Documentation 📖
Table of Contents
- Inputs
- Outputs
- Workflow
- Implementation details
- Screening for degron motifs
- Gravy hydrophobicity index
- Protein Stability Index (PSI)
- Reporting experimental PSI
- Predicting PSI with Machine Learning
- Degron conservation scores
- Proteomes and structural features
- How is disorder predicted?
- How are intrinsically disordered regions defined?
- How is secondary structure calculated?
- How are buried residues defined?
- Post-translational modifications
- Mutations
- Implementation of the tripartite degron model
- Proteolysis simulations
- E3 interactomes
- Visualization
- Customizable settings
- References
Inputs
There are four allowed query types:
- UniProt ID - UniProt ID of a protein (min. 50 amino acids long) from the canonical UniProt proteome of one of the 11 selected model organisms: H. sapiens, M. musculus, R. norvegicus, D. rerio, D. melanogaster, C. elegans, S. cerevisiae, S. pombe, A. thaliana, O. sativa, Z. mays
- Sequence - protein sequence in FASTA format, between 50 and 40,000 amino acids long, containing only 20 canonical amino acids
- Structure - protein monomer structure in the PDB format
- with only one model and one chain
- with continous numbering starting from 1 (to avoid inconsistency with overlaying data on the sequence; you can easily renumber your structure here)
- between 50 and 40.000 amino acids long
- containing 20 canonical amino acids only
- not exceeding 5 MB size
- 📝 Note: when uploading an AlphaFold2/RoseTTAFold model and selecting its pLDDT/LDDT scores to predict intrinsically disordered regions (IDRs), the latter must be in correct ranges (0-100 for AlphaFold2 and 0-1 for the RoseTTAFold model) in B-factor column of the PDB file (see How is disorder predicted?)
- Structure + UniProt ID - protein monomer structure in the PDB format meeting the same criteria as described above with additionally passed UniProt ID, which, if matching the structure and is present in our database, results in the display of post-translational modifications, mutations and all other data related to the query - it mimics the "Query by UniProt ID", but calculations are performed for the structure submitted by the user
Other data possible to pass:
- Calculate degron conservation - applicable when passing UniProt ID; allows calculation of degron conservation scores based on pre-calculated Multiple Sequence Alignments (MSAs) obtained from eggNOG5 database; see also Degron conservation scores
- Run Machine Learning - applicable to any input type; is applicable to any type of input data; allows to predict the Protein Stability Index (PSI) for N-/C-terminus of the query; see also Predicting PSI with Machine Learning
- Predict disordered regions based on - applicable to any input type; allows to choose between using pLDDT/LDDT values of the corresponding structure model and using the IUPRED3 software to predict disorder regions. Please note, that when querying by structure, it is on the user’s end to provide the correct type of the submitted structure (in "The submitted structure is" panel); otherwise, the disordered regions may be erroneously defined; see also How is disorder predicted?
- Define custom degron motifs - applicable to any input type; allows to define custom degron motifs, either as exact sequence motifs or regular expressions
- Define custom proteolytic sites - applicable to any input type; allows to define custom proteolytic sites, either as sequence motif with indicated cleavage site or as index of the cleavage site
- Upload custom Multiple Sequence Alignment - applicable to any input type; allows to upload MSA of the query protein's orthologs in FASTA format to check for degrons' conservation among them
- Pass UniProt ID of the structure - applicable when querying by structure; allows to additionally provide a UniProt ID, and if it matches the structure and is present in our database, the server displays post-translational modifications, mutations and all the other data associated with the query - it mimics the "Query by UniProt ID", but calculations are performed for the structure submitted by the user
Outputs
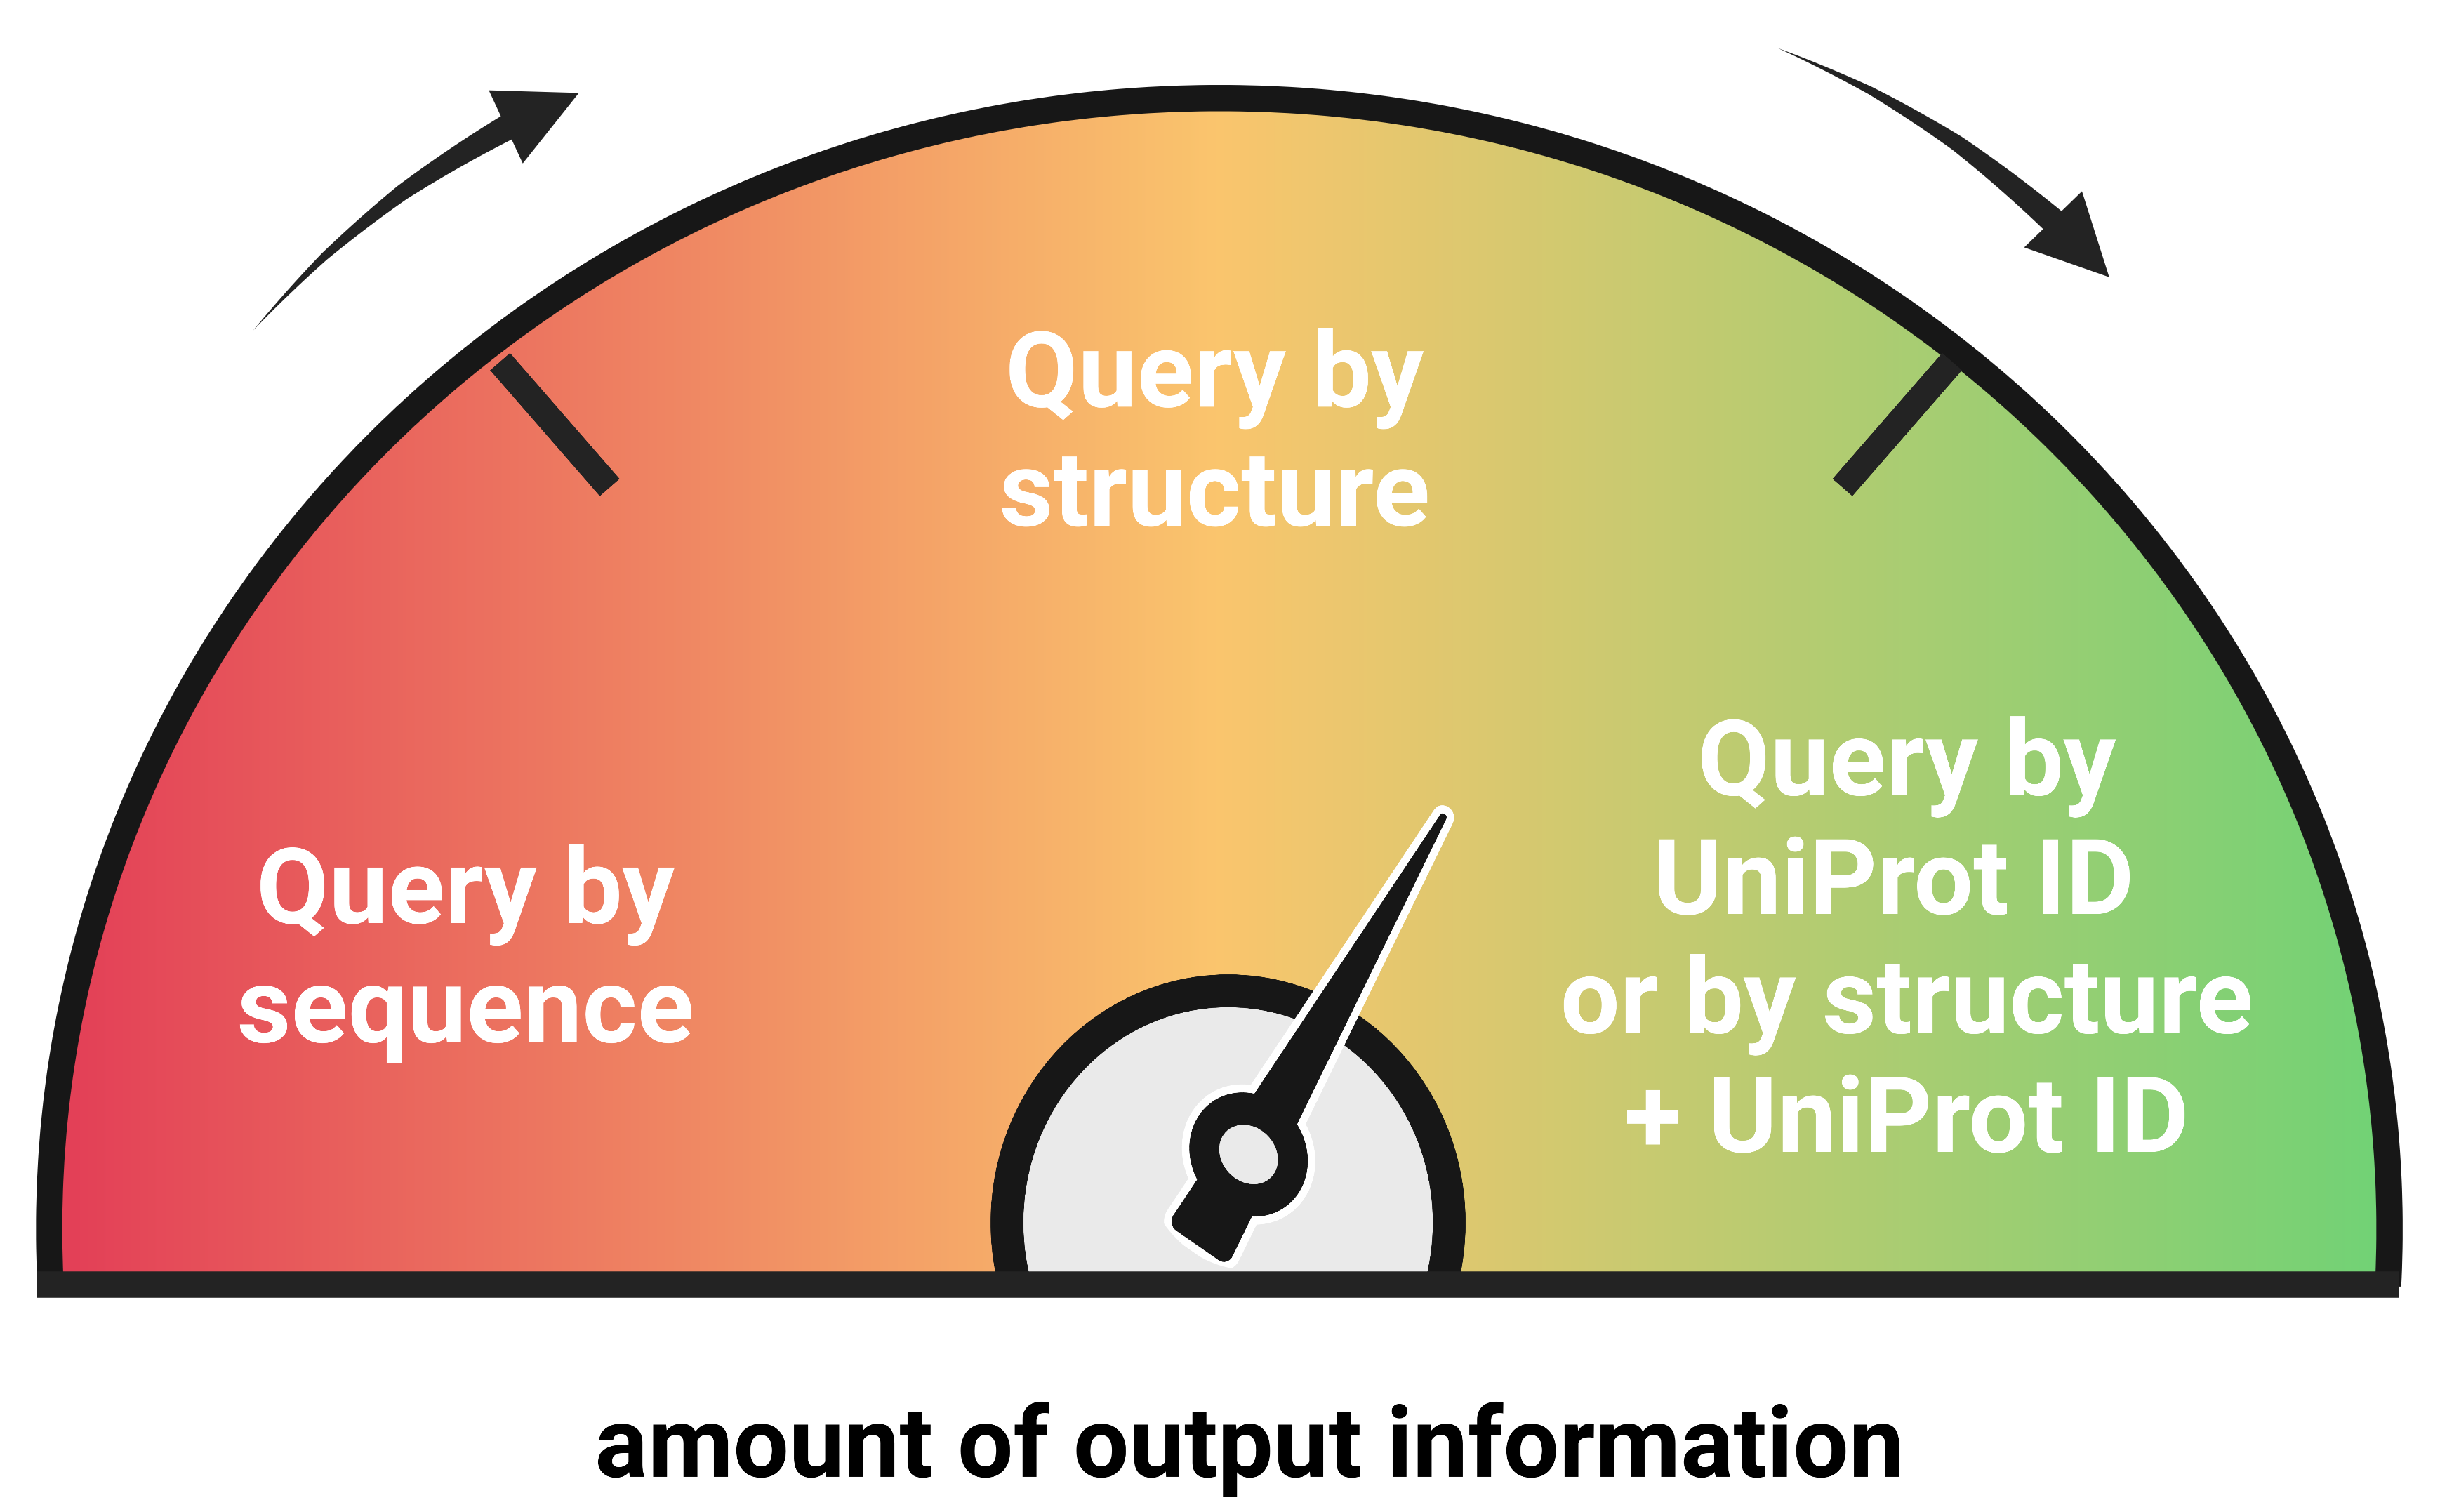
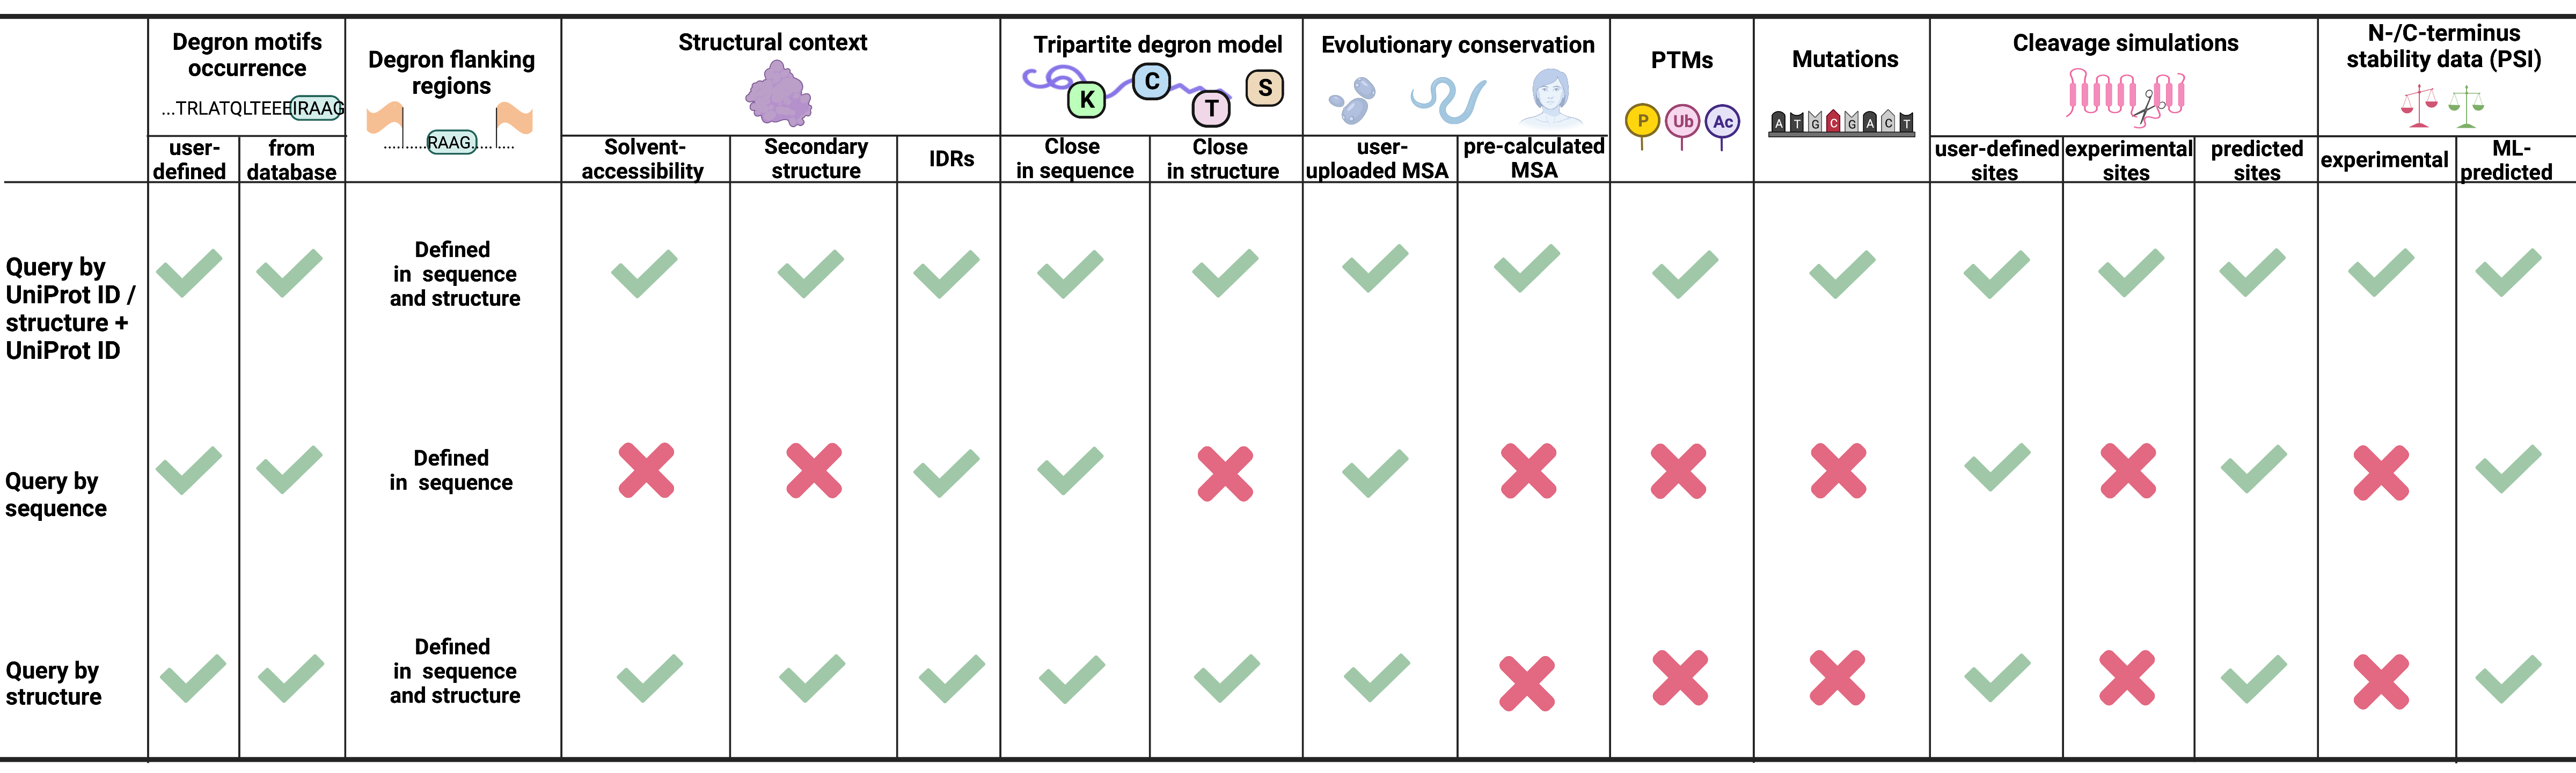
Depending on the input type, different granularity of degron-related output information is provided.
- Query by UniProt ID - provides the most comprehensive information about degron motifs in a query, including full tripartite degron model, as additional information about evolutionary conservation, structural context, post-translational modifications or mutations, is superimposed on the degron data
- Sequence - gives the least amount of output information compared to query by UniProt ID or structure, as no structure or post-translational modifications/mutations/experimental proteolytic site data are available (although information on disordered regions is present as predicted based on the query sequence using the IUPred3 software)
- Structure - provides a moderate amount of information, including a full tripartite degron model, but not as complete as the query by UniProt ID, because experimental data such as post-translational modifications or mutations are unavailable
- Structure + UniProt ID - provides the same information as the "Query by UniProt ID"
Workflow
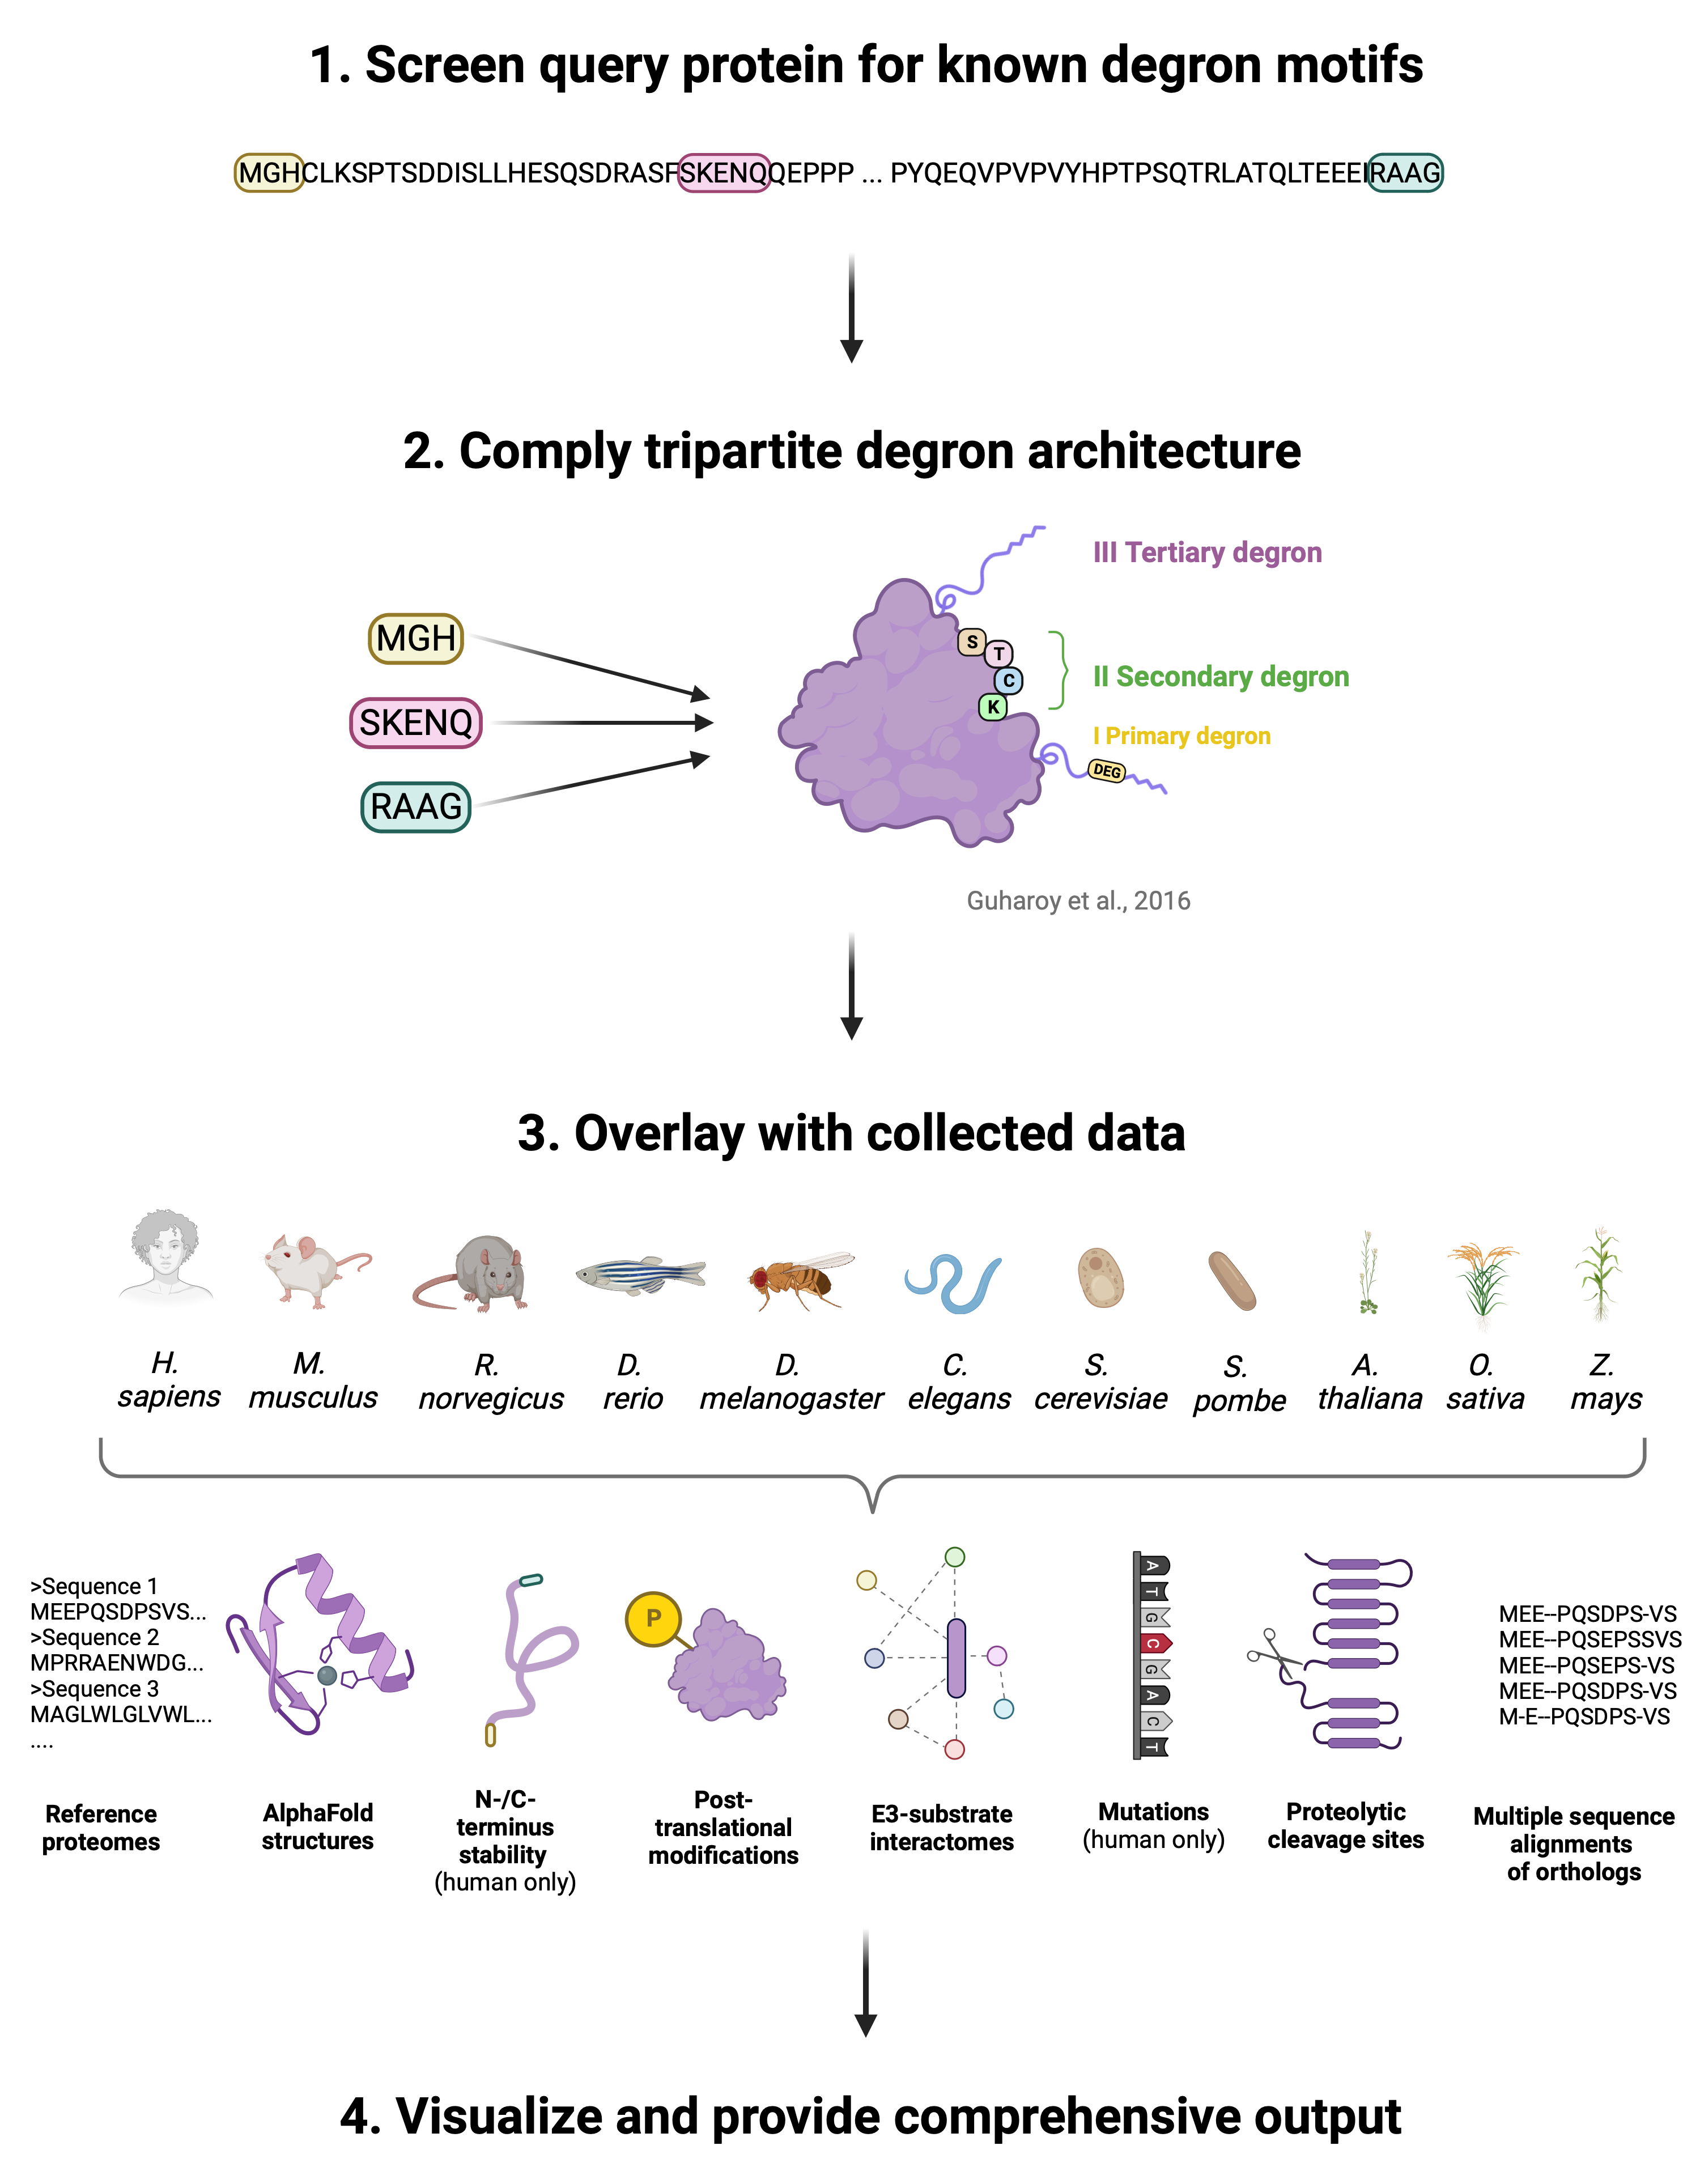
We outline the DEGRONOPEDIA workflow for queries using UniProt IDs, which offer the most exhaustive results. Other query types follow a similar process but lack certain analyses due to limited access to experimental data.
The workflow begins by screening the queried protein for degron motifs from our curated dataset, followed by calculating the Gravy hydrophobicity index1 of the protein's terminal 15 amino acids, a step informed by the significant role hydrophobicity plays in N-/C-degron recognition by various E3 ubiquitin ligases2-3. Subsequently, DEGRONOPEDIA offers experimental N-/C-terminus stability data, represented as Protein Stability Index (PSI) values (specifically for human proteins), sourced from Global Protein Stability (GPS) studies4-5. It also facilitates predictions using our pre-trained Machine Learning (ML) models. Since these models were developed using human PSI values, we suggest their use primarily for queries related to higher mammals. The server then visualizes PSI values, categorizing them into stability classes.
Additionally, we have integrated pre-calculated multiple sequence alignments (MSAs) and offer the option for users to submit custom MSAs, enabling the provision of evolutionary conservation scores derived from these alignments. Solvent-accessibility, location within an intrinsically disorder region (IDR), or lack of secondary structure are premises of a site acting as an actual degron6. Our server predicts IDRs and degrons’ disorder using AlphaFold2/RoseTTAFold models or IUPred3 software7, depending on the input type, and calculates secondary structure and relative solvent-accessibility for each degron motif.
As degron sites may undergo various PTMs, with the primary role of phosphorylation, which can modulate their exposure8, the server reports experimentally validated PTMs (up to 32 types) occurring within each found degron motif and its flanking regions. Amino acid substitutions in degron motifs can lead to altered protein stability, contributing to severe diseases such as cancer or neurodegeneration9,10, indicating critical sites for proper protein function. Therefore, our tool provides information about known missense mutations within the degron motifs and within PTMs in their flanking regions.
For each identified degron, the server also evaluates its context in the tripartite degron model6. In particular, the server provides information on solvent-accessibility, secondary structure, location within an IDR, mean disorder, PTMs, and mutations for each potentially-ubiquitinated residue (secondary degron; in our implementation, these are not only lysines (K) but also cysteines (C), serines (S), or threonines (T)) located within the degron flanking regions. Finally, the server reports the closest IDR (tertiary degron) to each of the secondary degrons.
It has been shown that protein turnover may be regulated by proteolytic enzymes that cleave the protein, leading to new N- and C-termini, which may act as degrons11. Thus, DEGRONOPEDIA simulates protein cleavage based on user-defined motifs, validated cleavage sites, or predicted sites for various proteases, subsequently screening the cleavage products for degrons.
The final information provided relates to E3 ligases known to interact with the queried protein.
The occurrence of degrons in the sequence, along with their unique features as described above, is visualized, and the outcomes are presented in easy-to-navigate interactive tables.
Implementation details
This section provides a detailed explanation of each piece of information utilized and/or computed by DEGRONOPEDIA, presented in the same order as in the output.
Screening for degron motifs
Dataset information
We compiled over X degron motifs from literature for degron screening. Each motif was defined as either N-terminus, C-terminus, or internal, regarding its occurrence location. N-terminus and C-terminus degron motifs derived from the Global Protein Stability (GPS) assays4-5 were among the top 3% highest delta Protein Stability Index (PSI) values, defined as >0.7 and >0.3, respectively (delta PSI refers to the difference in PSI value for each putative degron motif when it is located at the end of the peptide and internally, indicating how destabilizing each motif is relative to the terminus itself). The list of degron motifs is continuously updated and can be downloaded from the server.
Each query sequence is screened for the presence of known degron motifs, collected from the literature, using the regular expressions.
What is a regular expression?
Regular expression is a search pattern allowing for text screening to check its presence; see examples below.[AVP]x[ST][ST][ST]
means that there are 5 characters in the pattern
- first character: A or V or P
- second character: any (x indicates any character)
- third character: S or T
- fourth character: S or T
- fifth character: S or T
means that there are eight or nine characters in the pattern
📝 Note: {} brackets indicate number of occurrence.
- first character: F
- second character: any except P
- third character: any except P
- fourth character: any except P
- fifth character: W
- sixth: any except P
- seventh character: any except P
- eight character: either continuation of previous any except P, or if V or I or L would occur, this will be the final character
- ninth character - only if previous character was not V or I or L: V or I or L
the motif has to exactly match the pattern
^M{0,1}([ED])x
means that there are three characters in the pattern
📝 Note: {} brackets indicate number of occurrence.
📝 Note 2: ^ indicates that the pattern has to match the very beginning of the sequence
- first character: M occurs or does not occur
- second character: E or D
- third character: any
means that there are four characters in the pattern
📝 Note: $ indicates that the pattern has to match the very end of the sequence.
- first character: K
- second character: any
- third character: any
- fourth character: R
Gravy hydrophobicity index
Gravy (grand average of hydropathy) hydrophobicity index is calculated by adding the hydropathy value for each residue and dividing by the length of the sequence1.
Its higher values indicate that a sequence is more hydrophobic. In DEGRONOPEDIA, it is calculated for N-terminus (first 15 aa) and C-terminus (last 15 aa) of the input sequence.
Interpretation
Hydrophobic regions often determine the specificity for recognition by chaperones and protein quality control E3s, but they are less likely to be recognized by cullin-RING E3 ligases2-3,12-13.
Protein Stability Index (PSI)
Dataset information
The N-/C-termini stability data were obtained from the Global Protein Stability (GPS) assays4-5. These data cover the stability of N-/C-terminal 23-mers of 48251 (variants with N-terminal methionine and without it) and 22564 human proteins, respectively, and are represented as the Protein Stability Index (PSI), where its lowest values indicate the most unstable, thus possibly containing a degron motif, peptides. The PSI values for the N-terminus provide information about the experimental stability of the first 23 residues/24 residues of the protein, depending on whether PSI was measured for the cleaved initiator methionine or not, respectively (for more on the co-translational cleavage of methionine, when it occurs and the associated Ac/N-degron pathway, see, for example, this review). The PSI value for the C-terminus provides information about the experimental stability of the last 23 residues of the protein.
Reporting experimental PSI
Information on experimental PSI values is currently only available for human proteins. PSI is reported by the identity of the N-/C-terminus with the experimental data, not by the name of the protein due to possible inconsistencies in nomenclature (e.g., human protein A has an experimental C-terminal PSI value, but we are querying human protein B, whose name is absent from the experimental dataset, but which has an identical C-terminal peptide to protein A - so we report an identical C-terminal PSI value for protein B to that of protein A).
Interpretation
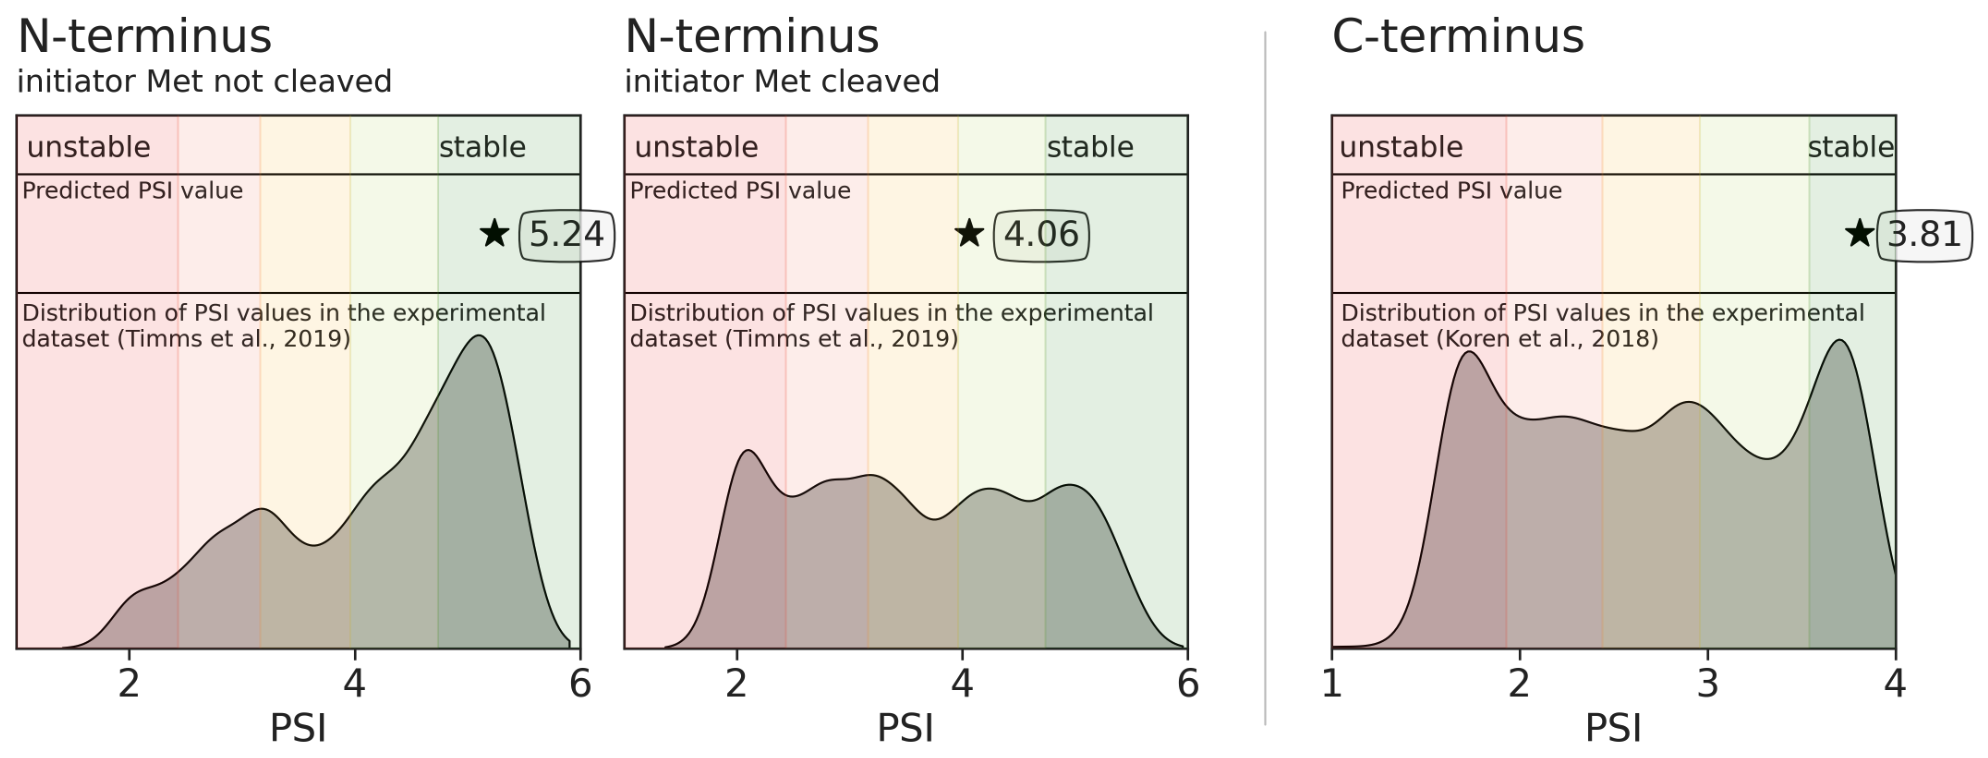
The higher the PSI value, the more stable the terminus is. Please refer to the provided distributions of the experimental data for each terminus.
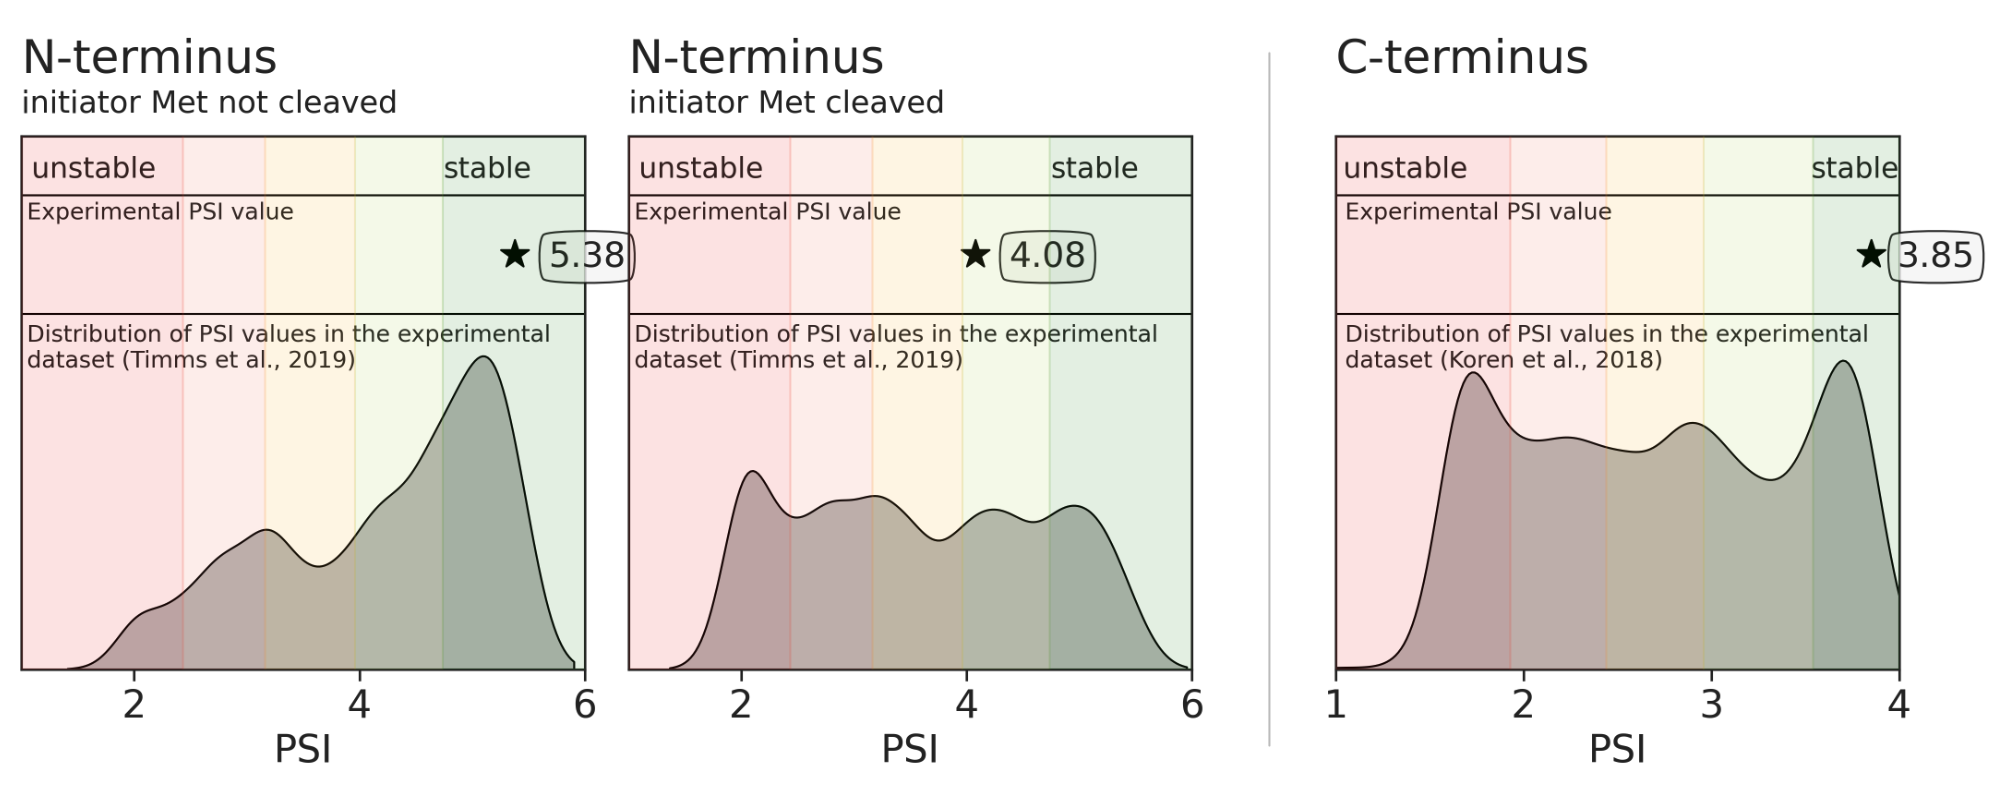
For the N-termini, the experimental PSI was measured in ranges of 1-6, while for the C-termini in ranges of 1-4.
Predicting PSI with Machine Learning
Method description
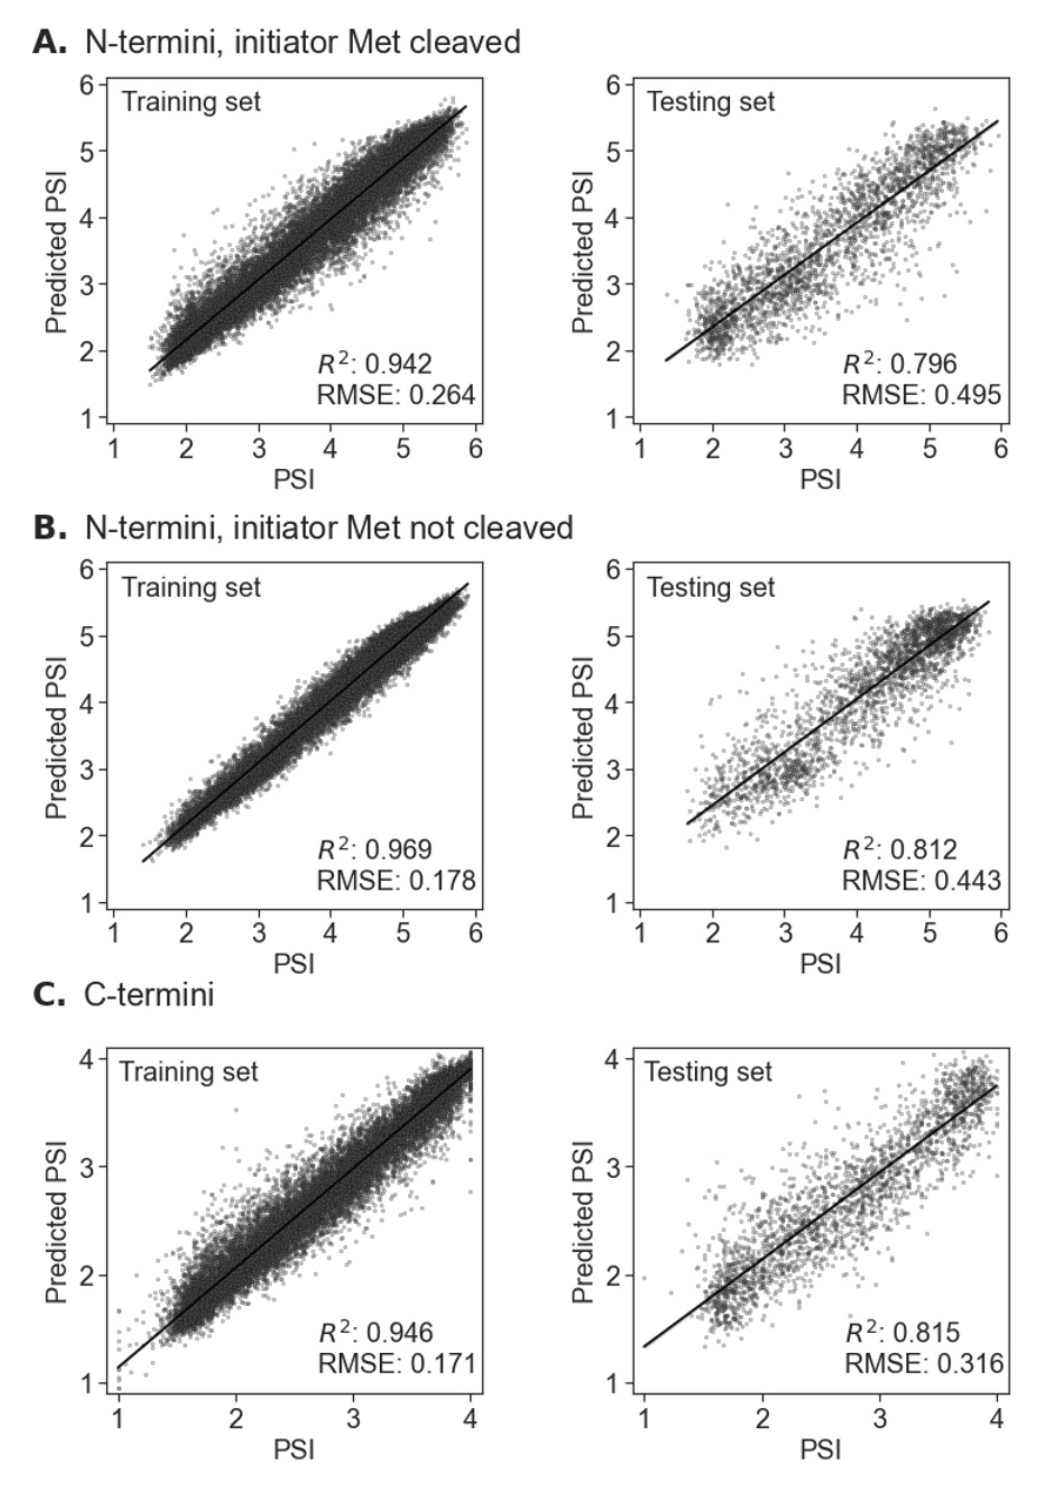
To develop our Machine Learning (ML) models, we used experimental N-/C-termini stability data4-5, expressed as PSI, from 23-mers covering the human proteome, considering both with and without the initial methionine residue in N-termini. The datasets were divided into training and testing sets (90:10 ratio), and CatBoost regression models14 were trained for each terminus (C-termini, N-termini with and without the initial methionine residue), optimizing hyperparameters with Optuna framework15 and five-fold cross-validation (using random permutations cross-validation implemented in the scikit-learn Python library, with a 20% validation set). Descriptors included peptide sequences, RDKit descriptors (RDKit: Open-source cheminformatics. https://www.rdkit.org), Gravy hydrophobicity index, and the Peptides module (https://github.com/althonos/peptides.py). All descriptors were calculated for the whole sequence, and the first (excluding the N-terminal methionine regardless of whether we considered it as present or absent) or the last (for the C-terminus) ten, eight, six, four, and two amino acids. Model performance was evaluated using a coefficient of determination (R2) and Root Mean Square Error (RMSE). The performance of all three models was similar, reaching R2 = 0.796 and RMSE = 0.495 for N-terminus with initiator methionine cleaved, R2 = 0.812 and RMSE = 0.443 for the N-terminus with initiator methionine not cleaved, and R2 = 0.815 and RMSE = 0.316 for C-terminus. The server visualizes predicted PSI values, mapping them to experimental data distributions and classifying them into stability categories using quantile thresholds.
For the N-termini, the experimental PSI was measured in ranges of 1-6, while for the C-termini in ranges of 1-4.
❗ We recommend running N-/C-termini stability predictions only on proteins from higher mammals, as our models were trained on human protein stability datasets.
Interpretation
The higher the PSI value, the more stable the terminus is. Please refer to the provided distributions of the experimental data for each terminus.
For the N-termini, the experimental PSI was measured in ranges of 1-6, while for the C-termini in ranges of 1-4.
📝 Note: If the initiator methionine is absent, only one PSI value is predicted for the case when it is cleaved.
Standalone software
Users interested in using our Machine Learning models to perform high-throughput predictions of protein N-/C-termini stability can use our standalone software available at github.com/filipsPL/degronopedia-ml-psi.Degron conservation scores
Dataset information
Pre-calculated multiple sequence alignments (MSAs) of predicted orthologs were obtained from the eggNOG5 database at various taxonomic levels
| Species | Orthologous Group 1 | Orthologous Group 2 | Orthologous Group 3 | Orthologous Group 4 | Orthologous Group 5 | Orthologous Group 6 |
|---|---|---|---|---|---|---|
| H. sapiens | Hominidae (9604) | Euarchontoglires (314146) | Mammalia (40674) | Vertebrata (7742) | Ophistokonta (33154) | Eukaryota (2759) |
| R. norvegicus | Rodentia (9989) | Euarchontoglires (314146) | Mammalia (40674) | Vertebrata (7742) | Ophistokonta (33154) | Eukaryota (2759) |
| M. musculus | Rodentia (9989) | Euarchontoglires (314146) | Mammalia (40674) | Vertebrata (7742) | Ophistokonta (33154) | Eukaryota (2759) |
| D. rerio | Actinopterygii (7898) | - | - | Vertebrata (7742) | Ophistokonta (33154) | Eukaryota (2759) |
| D. melanogaster | Drosophilidae (7214) | Diptera (7147) | Insecta (50557) | - | Ophistokonta (33154) | Eukaryota (2759) |
| C. elegans | Rhabditida (6236) | - | - | - | Ophistokonta (33154) | Eukaryota (2759) |
| S. cerevisiae | Saccharomycetaceae (4893) | Saccharomycetes (4891) | Ascomycota (4890) | Fungi (4751) | Ophistokonta (33154) | Eukaryota (2759) |
| S. pombe | Taphrinomycotina (451866) | Saccharomycetes (4891) | Ascomycota (4890) | Fungi (4751) | Ophistokonta (33154) | Eukaryota (2759) |
| A. thaliana | Brassicales (3699) | - | Viridiplantae (33090) | - | - | Eukaryota (2759) |
| O. sativa | Poales (38820) | - | Viridiplantae (33090) | - | - | Eukaryota (2759) |
| Z. mays | Poales (38820) | - | Viridiplantae (33090) | - | - | Eukaryota (2759) |
Conservation scores
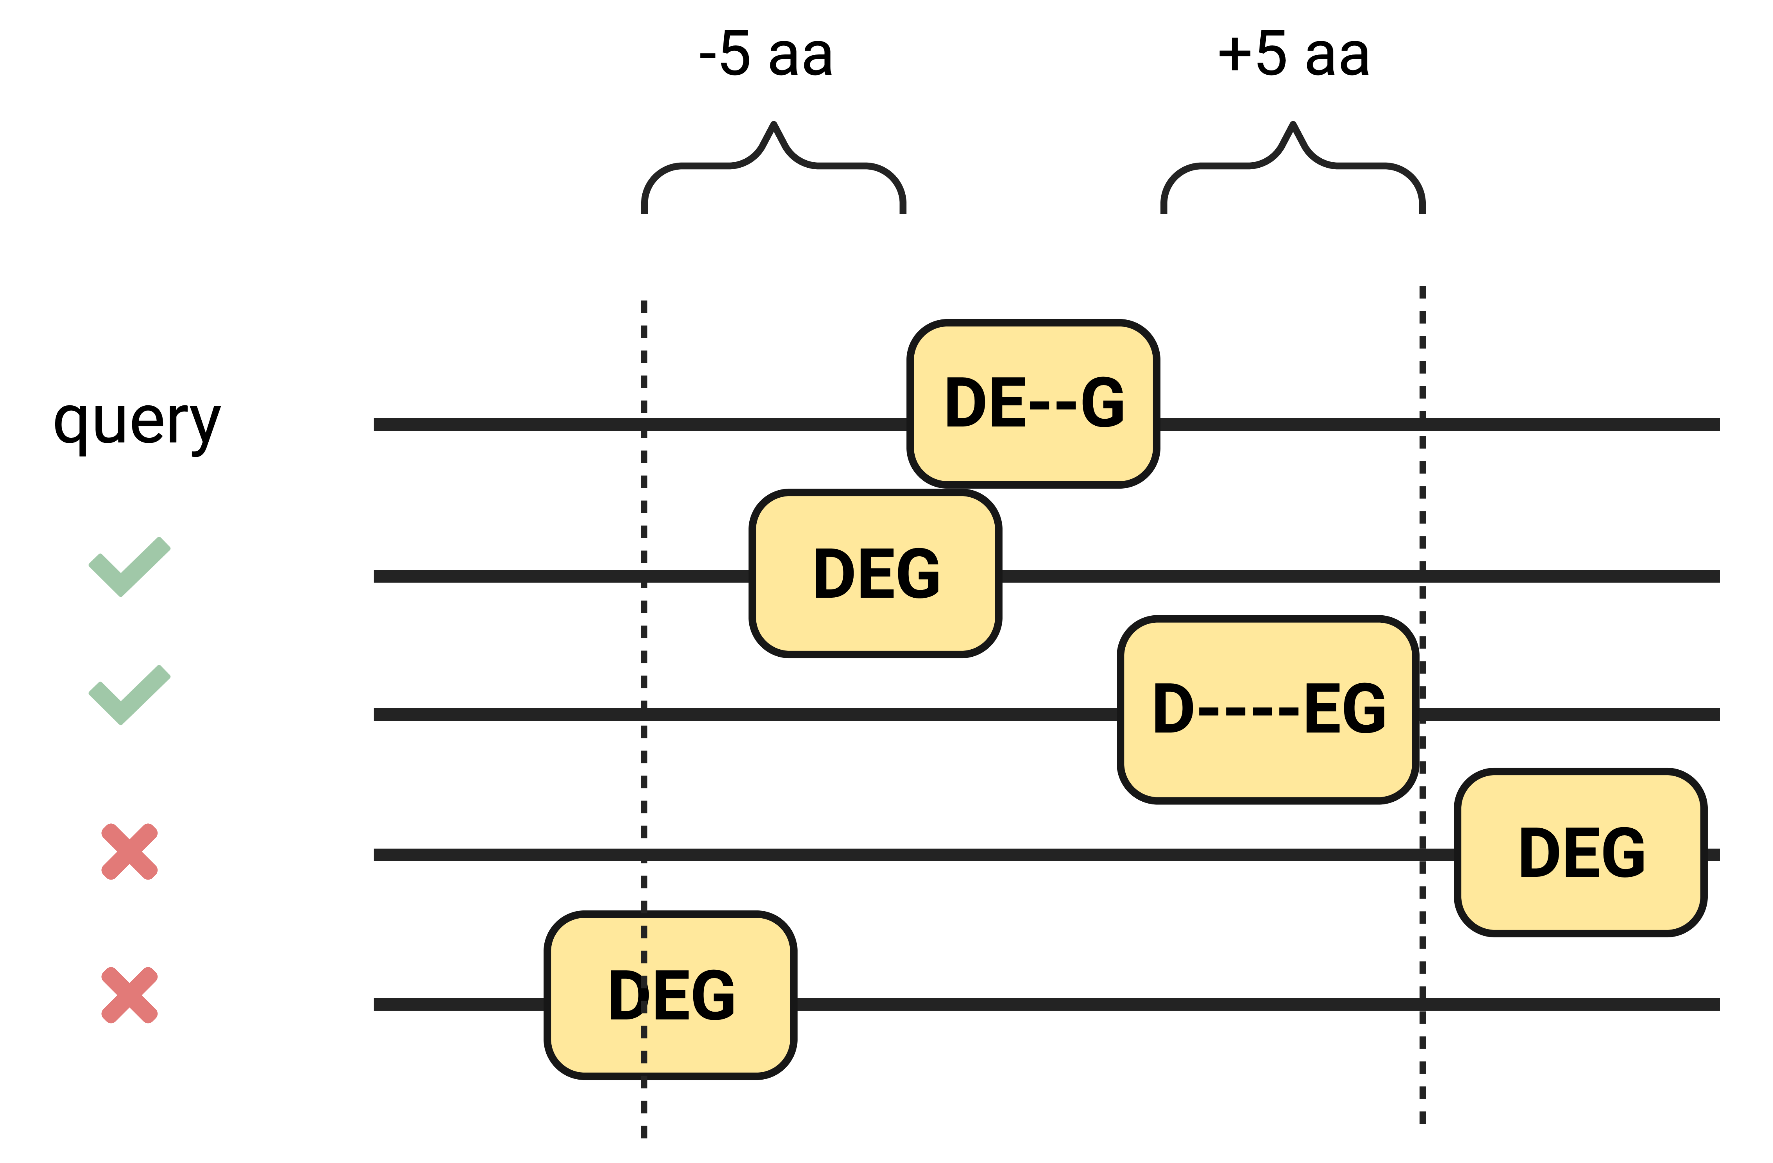
Four different degron conservation scores can be calculated, providing insight into the degron motif conservation among orthologs.
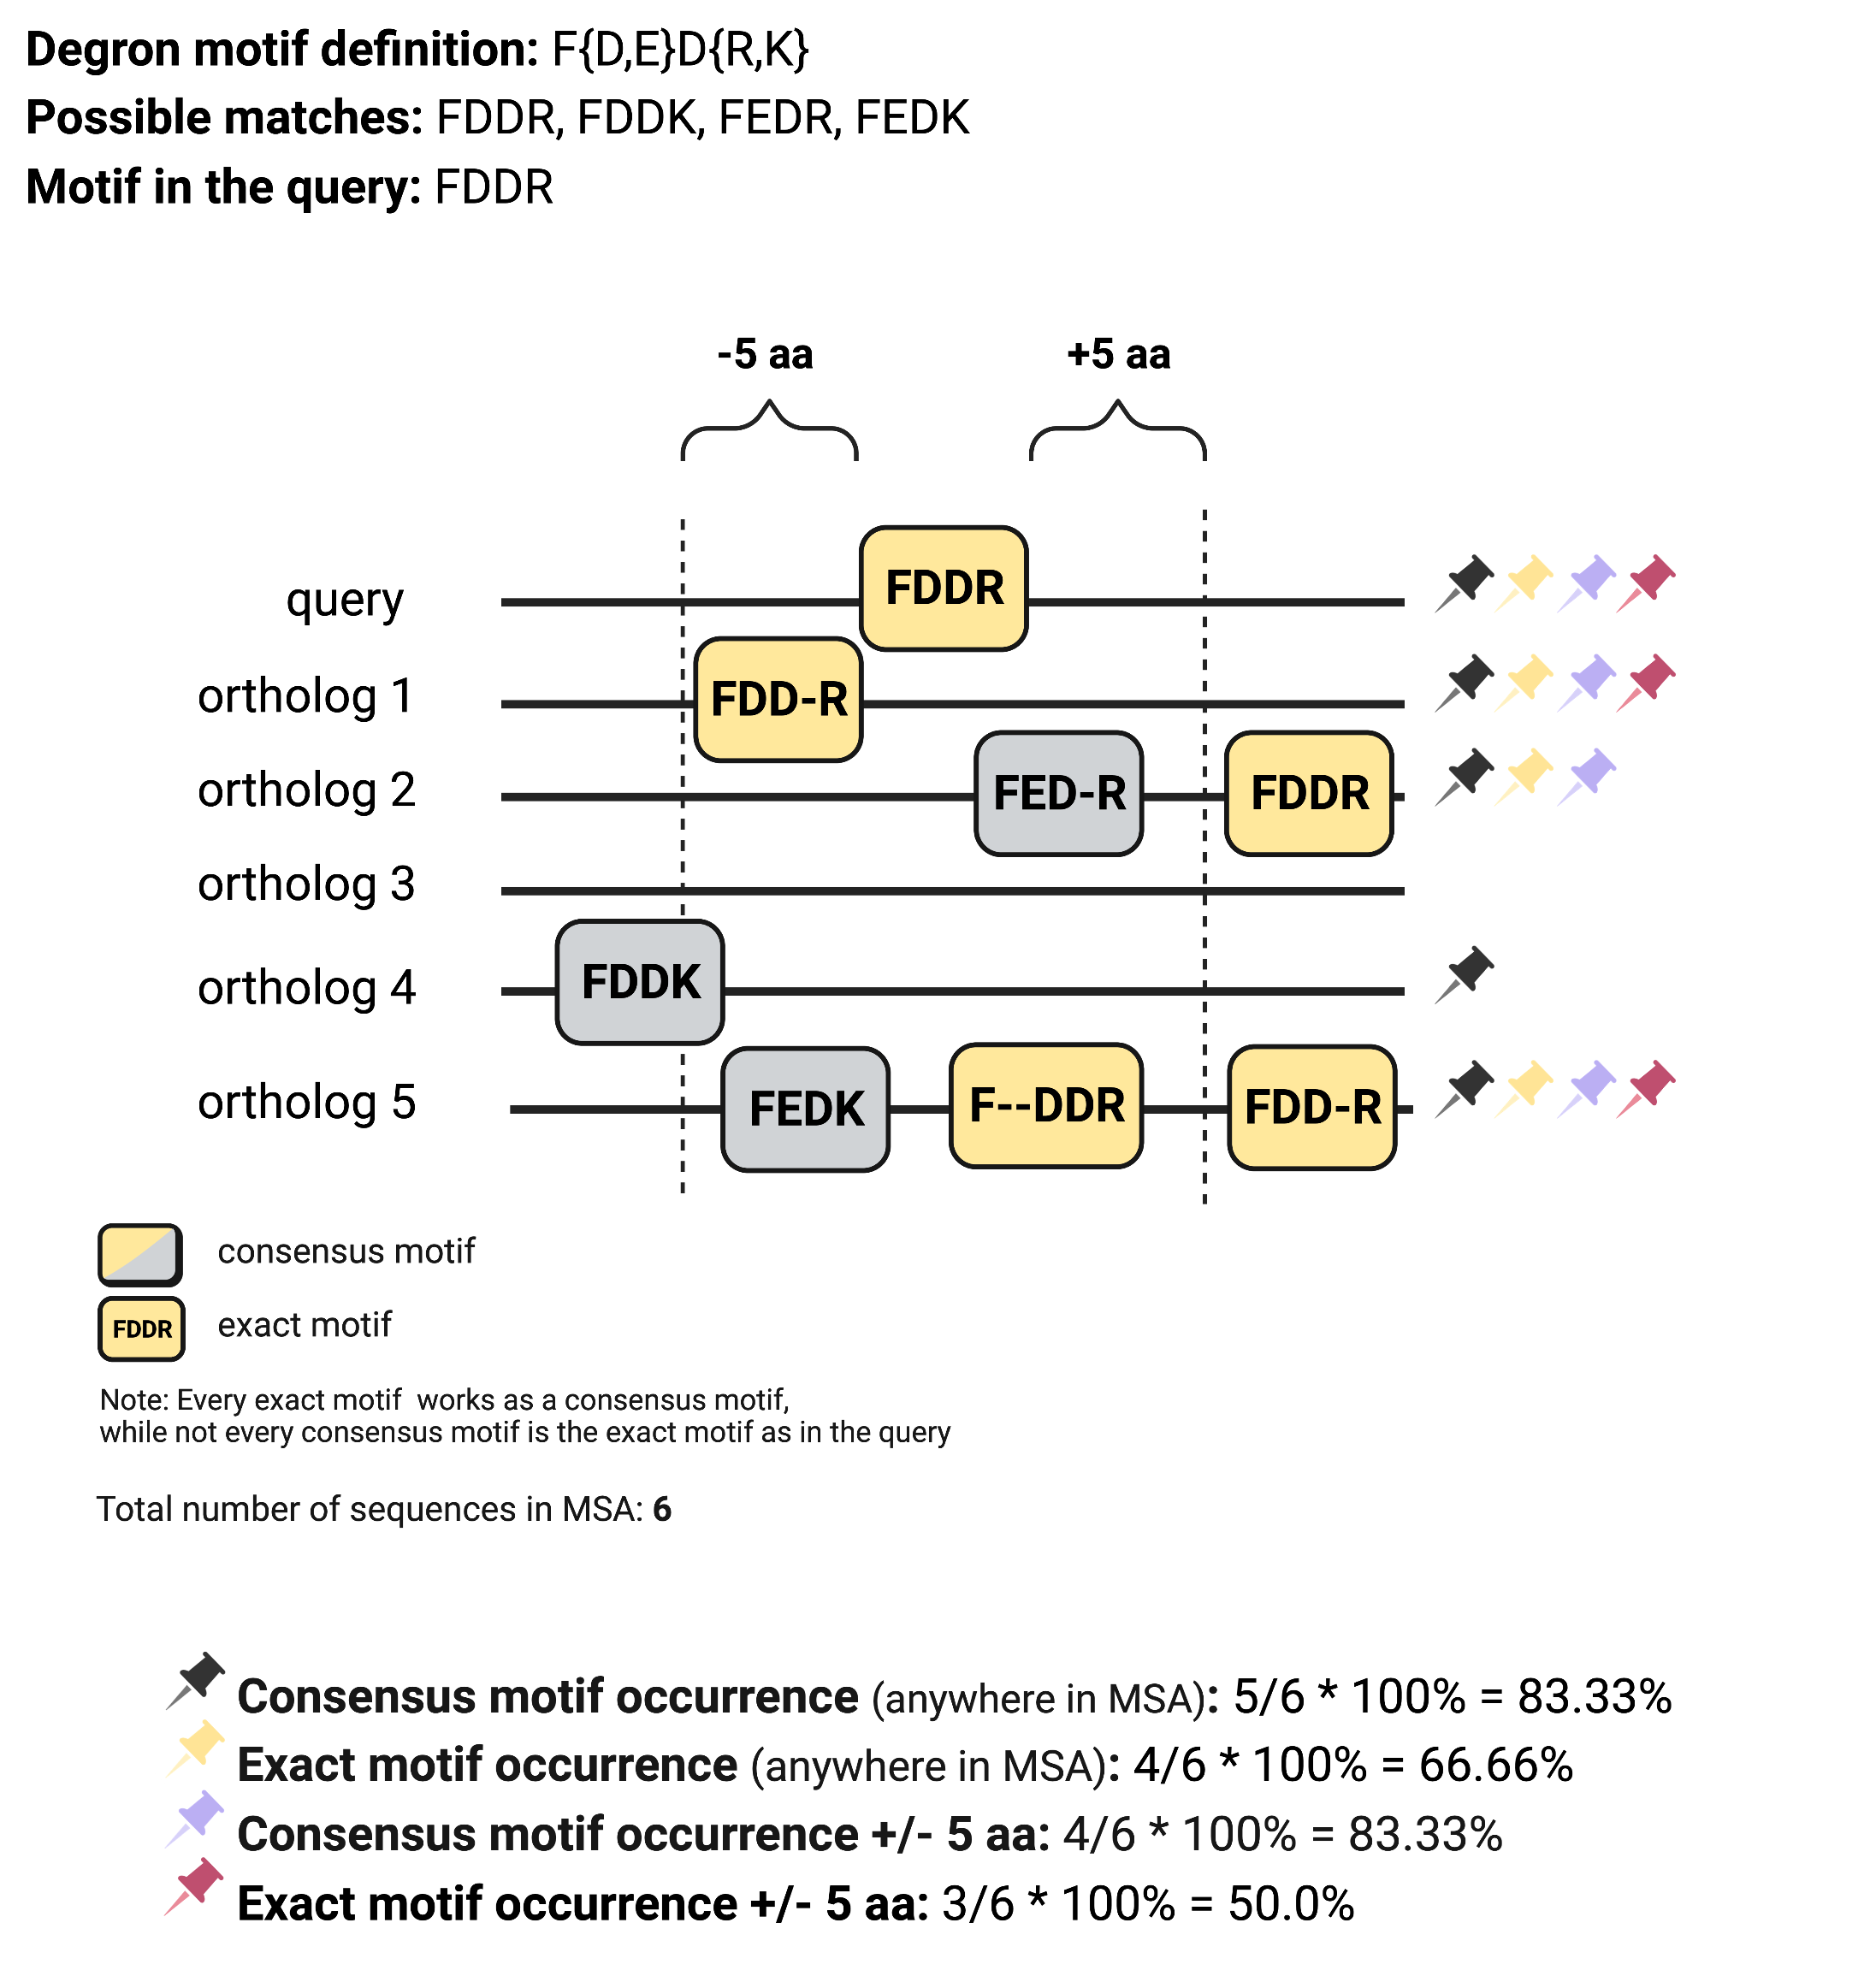
Maximum distance from the degron motif in the query to its orthologs to consider them as conserved was defined as 5 aa.
Gaps in the alignment within the degron motifs are marked with horizontal dashes.
Pre-calculated MSAs are available when querying by UniProt ID or by structure + UniProt ID. Regardless of the query type, the user can also submit their custom MSA in FASTA format containing no more than 200 sequences to check the conservation of each degron motif found in the query.
The maximum distance to regions upstream and downstream of the ends of the degron motif in the query to its orthologs in the MSA to consider it as evolutionarily conserved is defined in the Maximum distance from the degron motif in query to consider the same degron motif from the ortholog as conserved parameter.
Proteomes and structural features
Dataset information
Reference proteomes for H. sapiens, M. musculus, R. norvegicus, D. rerio, D. melanogaster, C. elegans, S. cerevisiae, S. pombe, A. thaliana, O. sativa, and Z. mays were obtained from the UniProt database (IDs: UP000005640, UP000000589, UP000002494, UP000000437, UP000000803, UP000001940, UP000002311, UP000002485, UP000006548, P000059680, UP000007305, respectively), with structural models from the AlphaFold Protein Structure database. In cases of proteins exceeding 2700 amino acids, an in-house script using Biopython merged AlphaFold2 model fragments into single PDB files.
🔵 How is disorder predicted?
There are two options to predict disordered regions in the query:
- based on the pLDDT/LDDT values of the model (applies to query by UniProt ID or structure)
- based on the sequence-based prediction from the IUPred3 software (applies to all query types)
Disorder predictions based on the pLDDT/LDDT values
❗ Requires calculations to be performed on AlphaFold2/RoseTTAFold model - B-factor column in PDB file must contain valid pLDDT/LDDT scores.
The pLDDT (Predicted Local Distance Difference Test; ranges 0-100) or LDDT (Local Distance Difference Test; ranges 0-1) score estimates the accuracy of the modeled residues, and those with pLDDT values above 70 are generally expected to be well modeled, while pLDDT below this value correlates with disordered regions16.
📝 Note: When uploading a RoseTTAFold model, we recommend using a model obtained from a local RosetTTAFold run, as its B-factor column contains the LDDT scores. Please do not directly upload a RosetTTAFold model obtained from the ROBETTA server, as its B-factor column holds the estimated RMSD error (although it is possible to convert these values to LDDT scores using, e.g., PHENIX software.
Disorder predictions based on the IUPred3 software
❗ Applies to any query type, as is IUPred3 software predicts disorder based on query sequence.
IUPred3 predicts a disorder score, ranging from 0 to 1, for each amino acid in the sequence. The default threshold above which the residue can be considered as disordered is 0.5, according to the authors of this tool, but it can be adjusted in the IUPred3 disorder threshold parameter.
📝 Note: IUPred3 is run as a standalone tool using default settings (long disorder is predicted).
🟣 How are intrinsically disordered regions defined?
Intrinsically disordered regions (IDRs) are defined as a continuous region with the minimum number (defined in the Minimum continuous IDR length parameter) of consecutive residues considered as disordered according to an appropriate threshold depending on the user's choice of disorder prediction method (this threshold is either defined in the parameter pLDDT/LDDT disorder threshold or IUPRED3 sequence-based predictions).
🟢 How is secondary structure calculated?
The secondary structure is calculated (not predicted) based on the protein structure using the DSSP software.
| Symbol | Secondary structure |
|---|---|
| H | Alpha helix (4-12) |
| B | Isolated beta-bridge residue |
| E | Strand |
| G | 3-10 helix |
| I | Pi helix |
| T | Turn |
| S | Bend |
| - | Coil |
🟡 How are buried residues defined?
Relative solvent accessibility (RSA) of a protein residue is a measure of its solvent exposure. It is calculated using the DSSP software and normalized by the Sander's method17. A residue is considered as buried if its RSA value is below the threshold defined in the Buried residue threshold parameter.
Interpretation
RSA values range from 0-1, where lower values indicate more buried residues.
Post-translational modifications
Dataset information
Post-translational modification (PTMs) datasets were obtained from the following sources, which combine high- and low-throughput experimental data:
- iPTMNet - acetylation, carboxylation, C-glycosylation, dihydroxylation, farnesylation, methylation, myristoylation, N-glycosylation, N-phosphorylation, O-glycosylation, phosphorylation, S-glycosylation, S-nitrosylation, sumoylation, and ubiquitination
- PhosphoSitePlus - acetylation, GalNAc, GlcNAc, methylation, mono-/di-/trimethylation, phosphorylation, sumoylation, and ubiquitination
- Plant PTM Viewer - 2-hydroxyisobuturylation, N-acetylation, N-glycosylation, N-proteolysis, O-GlcNAc, S-nitrosylation, S-sulfenylation, dimethylation, malonylation, myristoylation, phosphorylation, reversible cysteine oxidation, sumoylation, succinylation, and ubiquitination
- PLMD - formylation and neddylation
- literature - manually compiled datasets of non-canonical ubiquitination and arginylation
💭 What is the importance of a degron being a phosphodegron?
Phosphodegron contains one or more phosphorylated residues which may modulate the degron's accessibility. See review on this topic.
Mutations
Dataset information
Human mutations data, specifically 'Substitution - Missense' types, were obtained from the COSMIC database - the world's largest and most comprehensive resource of somatic mutations in human cancers.
📝 Note: Mutation data is only available when querying human proteins by UniProt ID (or when passing it along with the structure).
Implementation of the tripartite degron model
Tripartite degron model
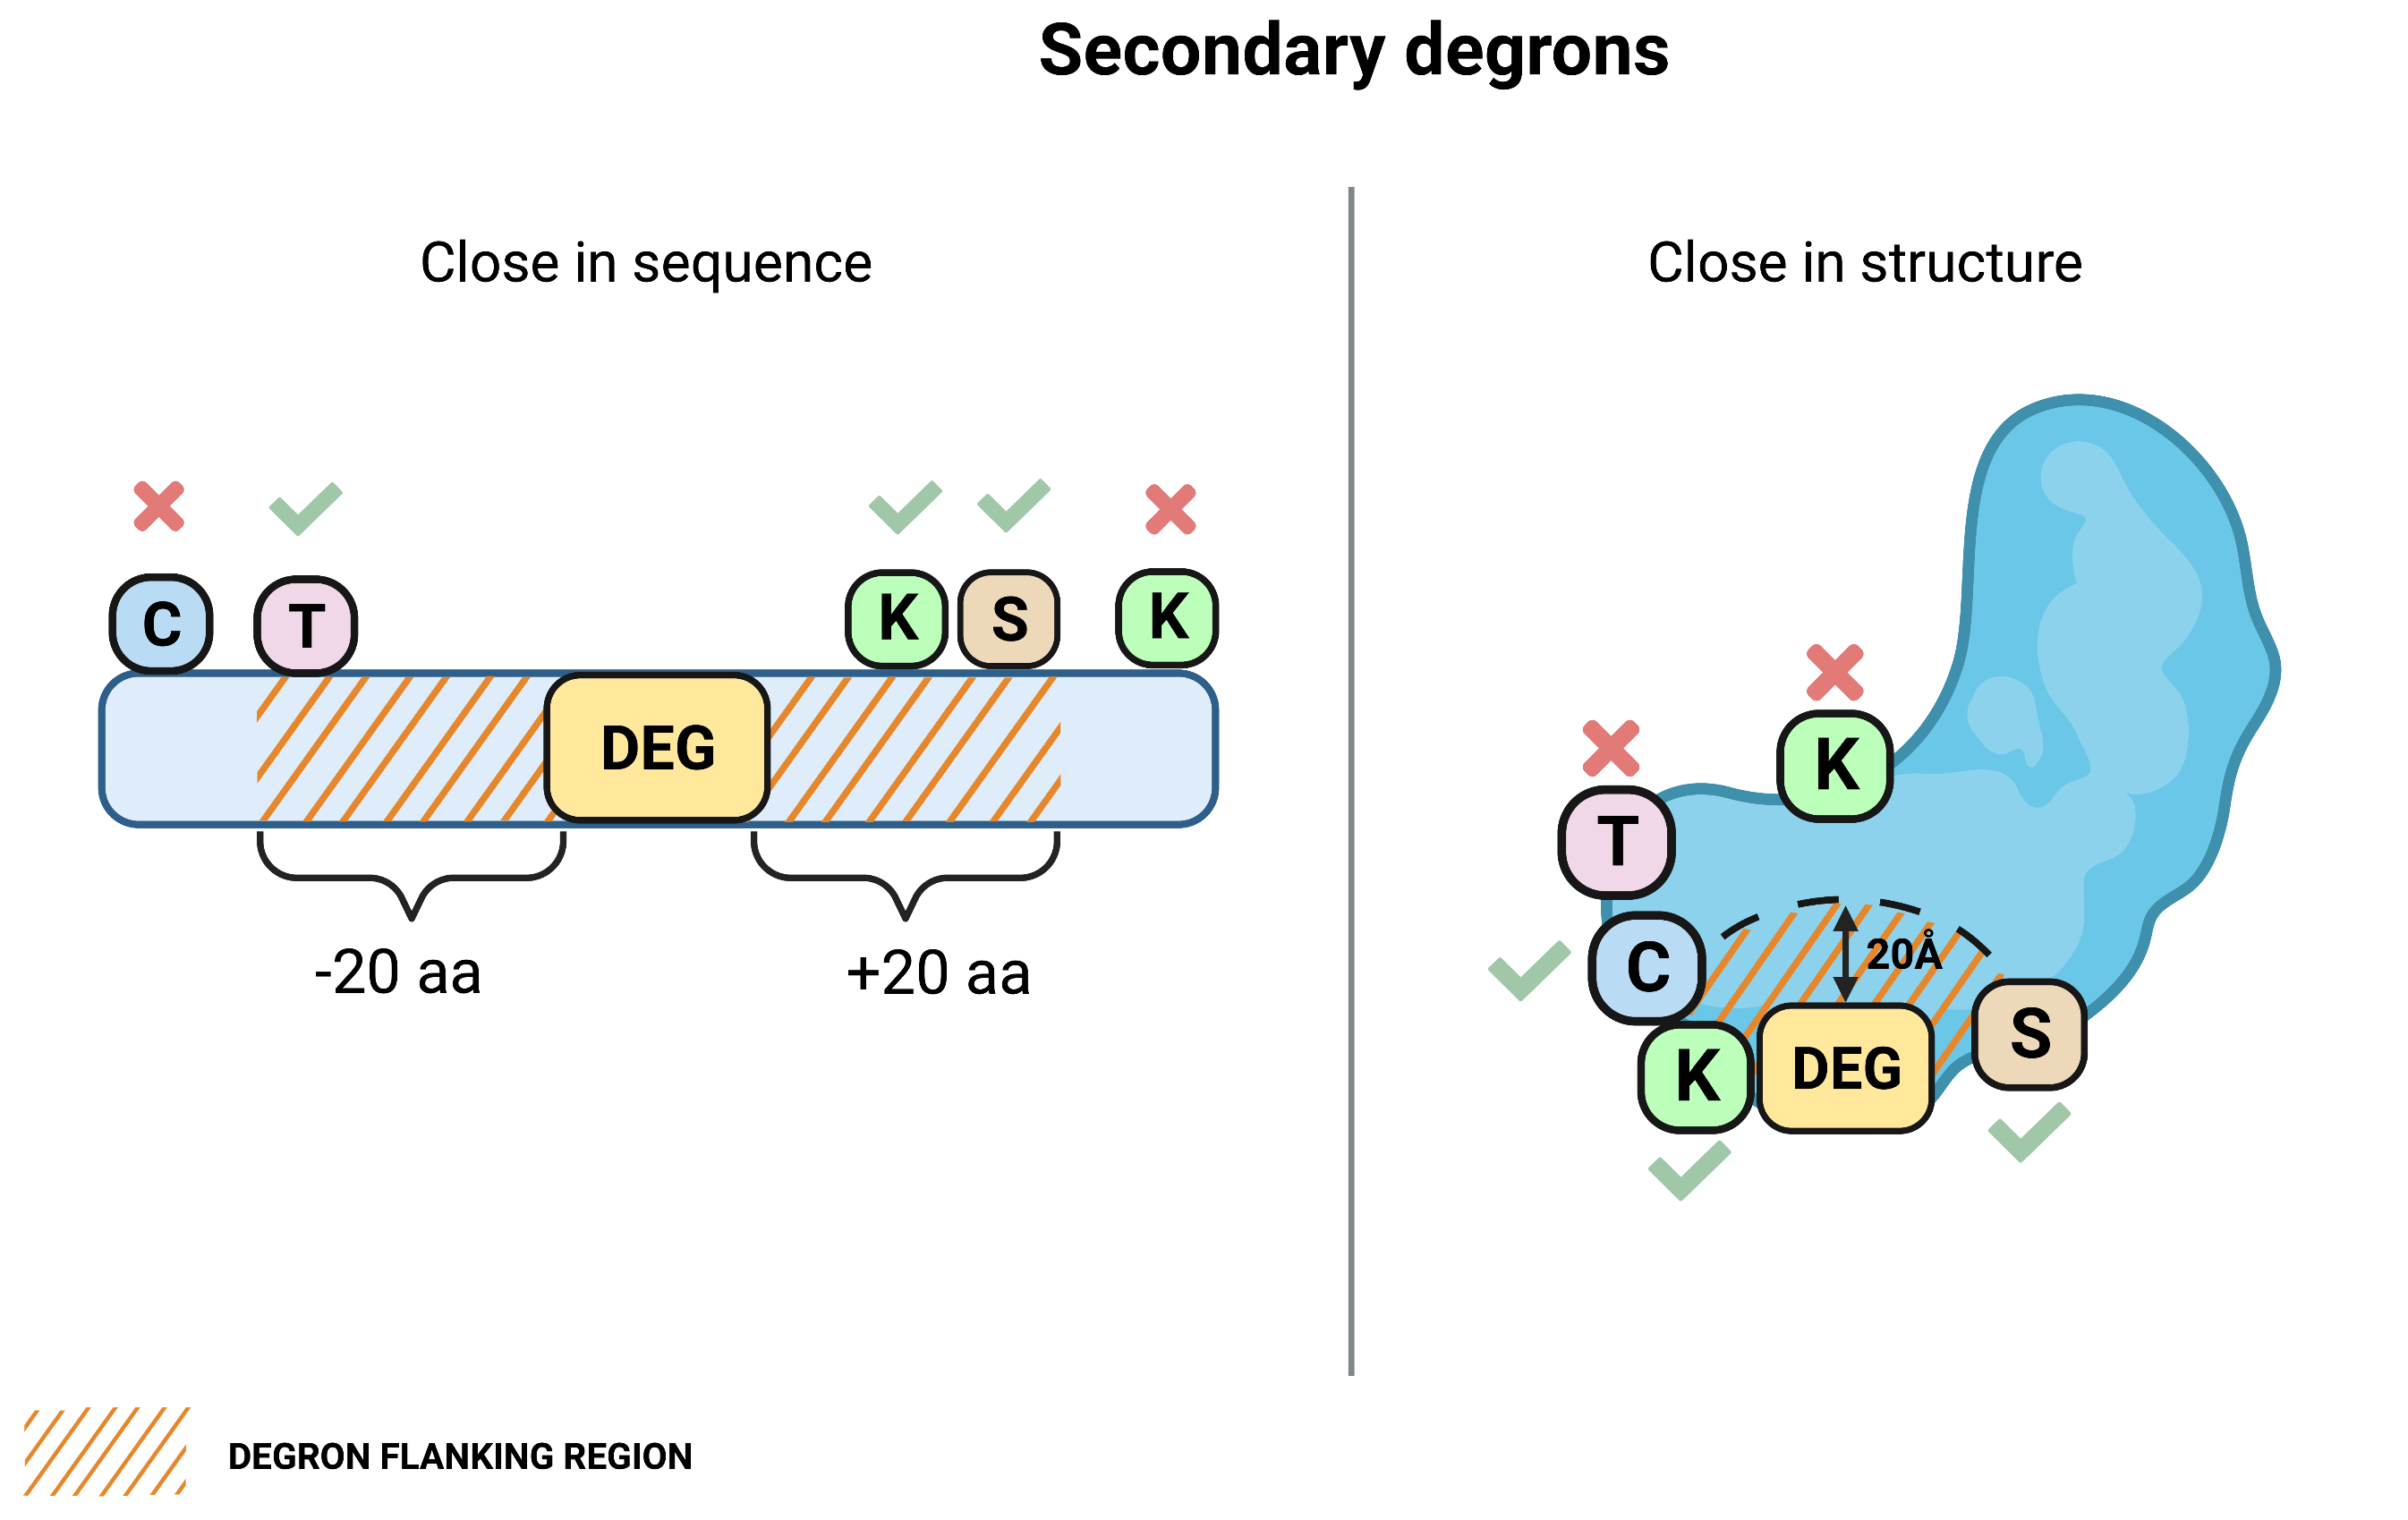
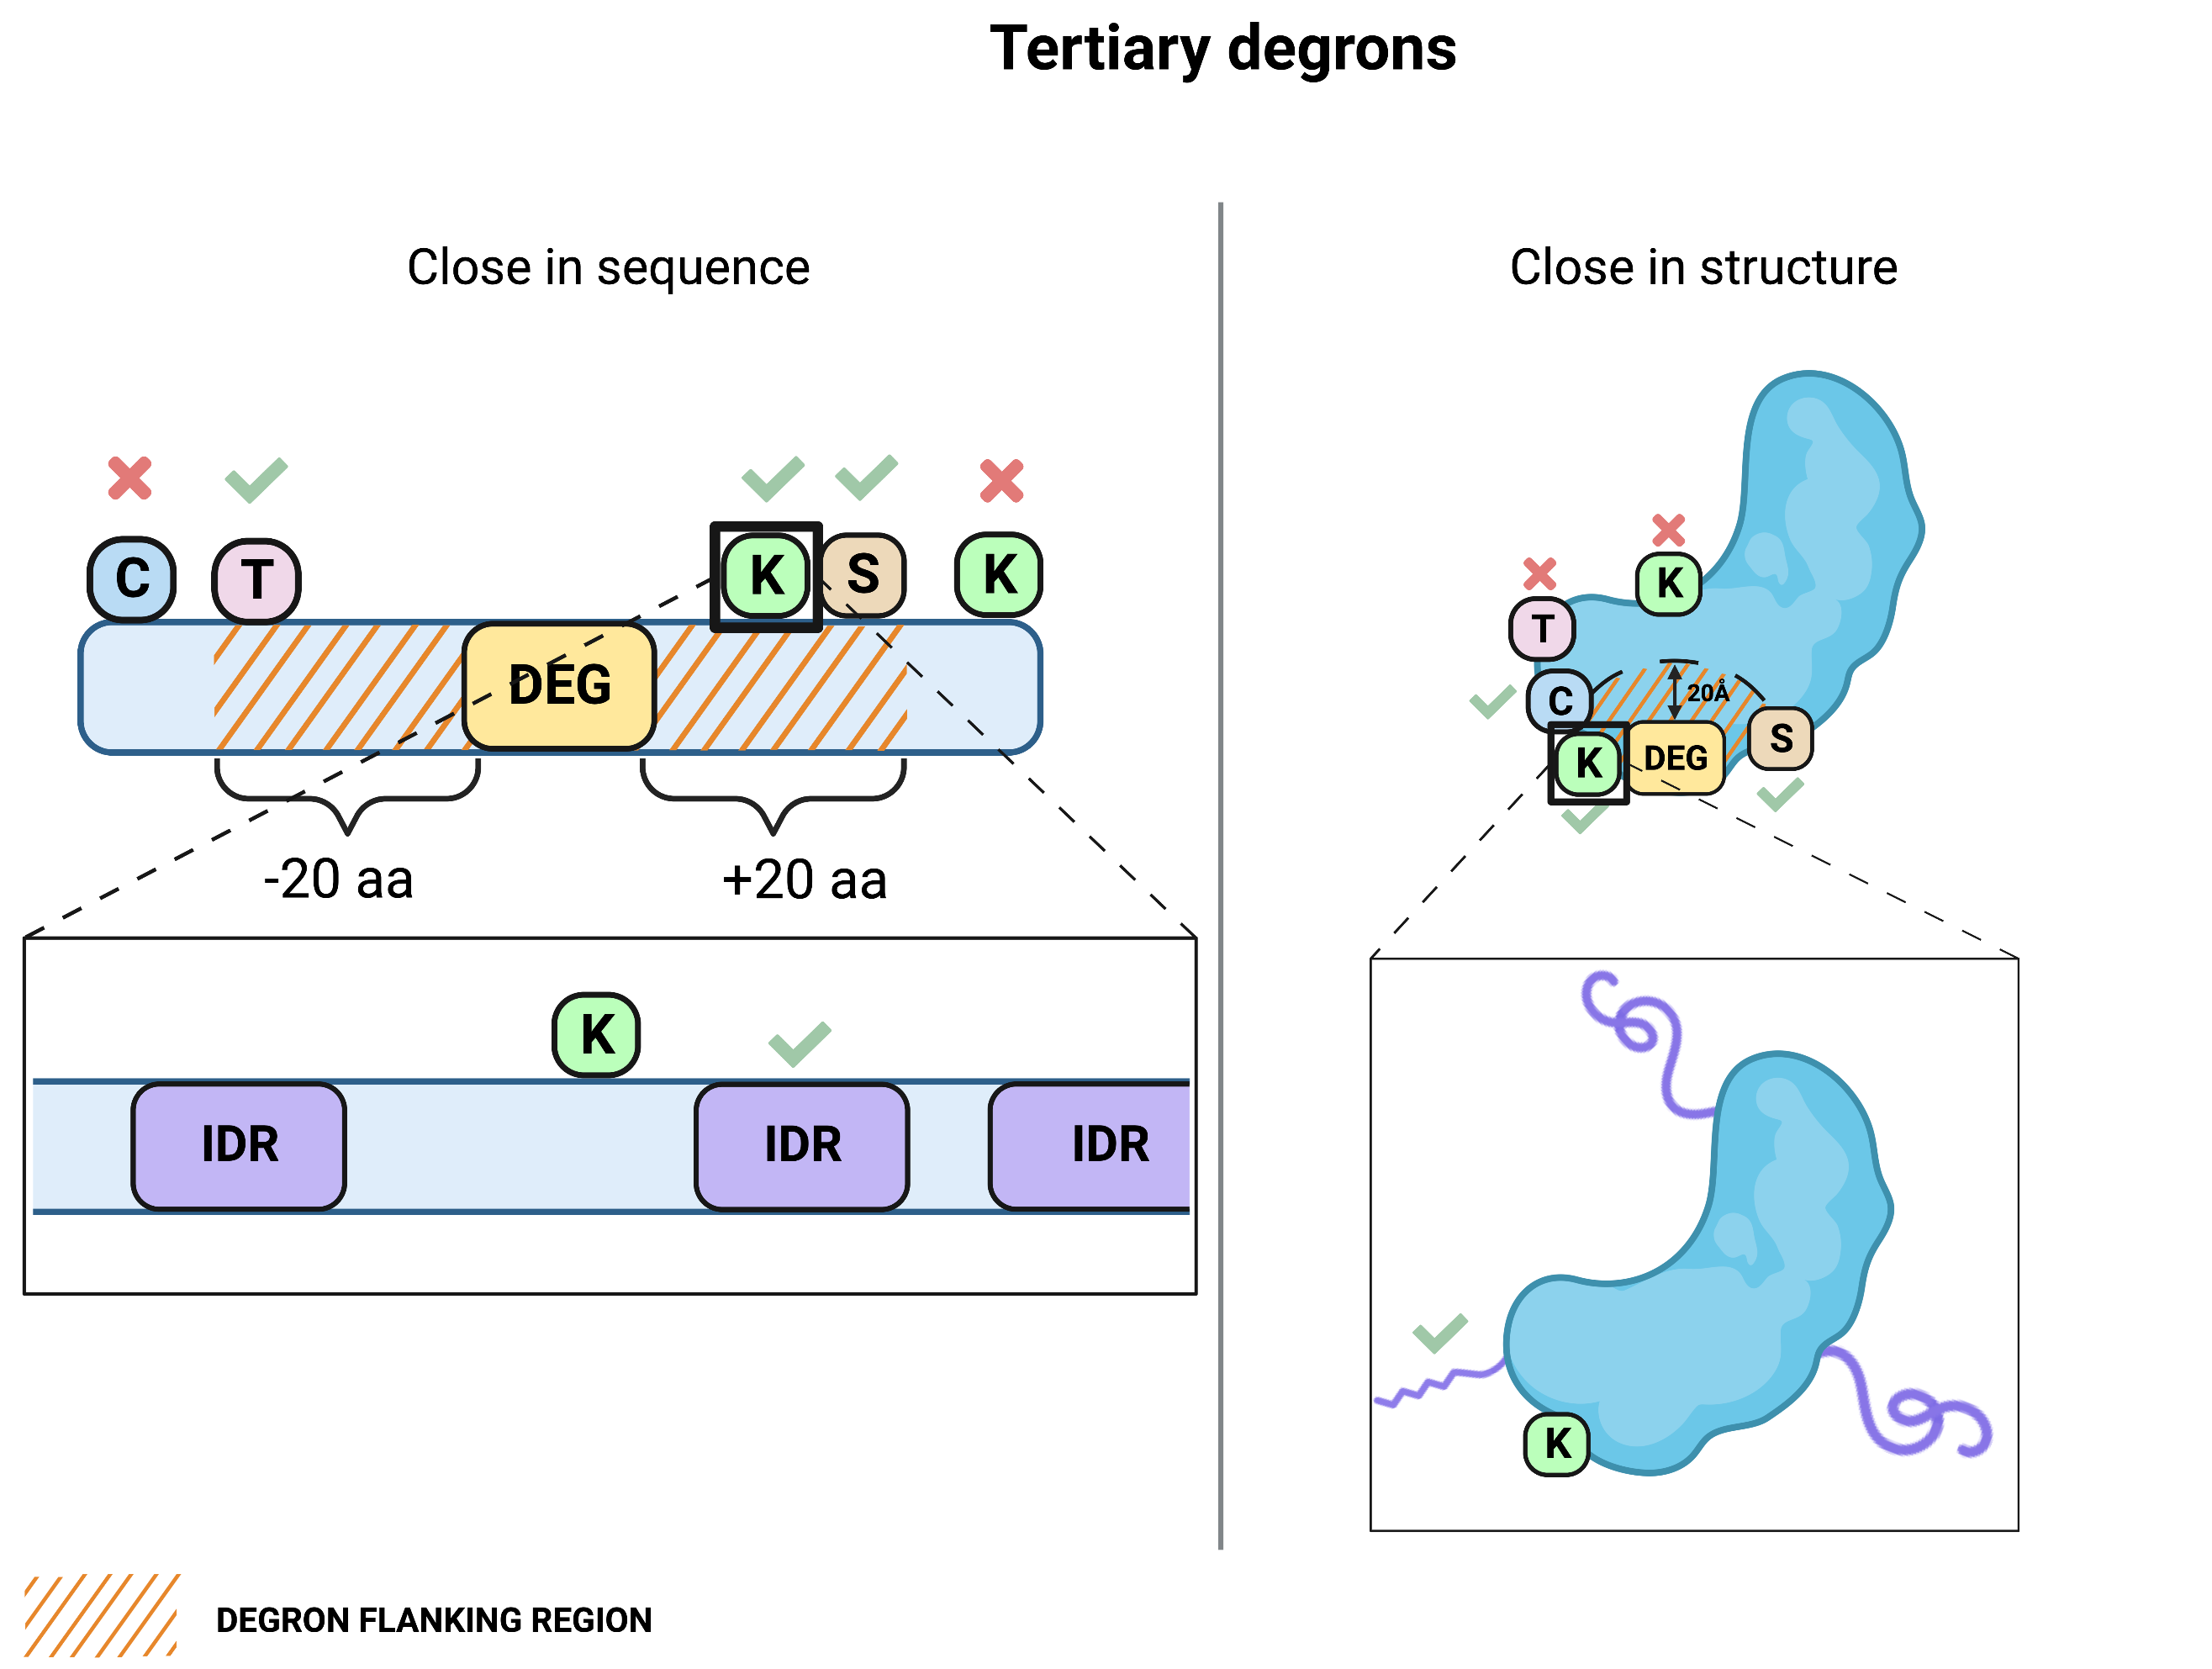
Guharoy and colleagues6 suggested a tripartite degron model where the primary degron is a short linear motif recognized by an E3 ligase, localized preferentially within an intrinsically disordered region (IDR) of the protein. The secondary degron refers to lysines to which ubiquitin may be attached, and the tertiary degron is an IDR close to the secondary degron, which acts as an unfolding seed initiating proteasome-dependent protein degradation.
The secondary and tertiary degrons are suggested to play subsidiary roles that affect ubiquitin-signaling - lack of a component of the tripartite degron model, e.g., IDR near a ubiquitinated lysine can result in non-proteolytic ubiquitination functions.
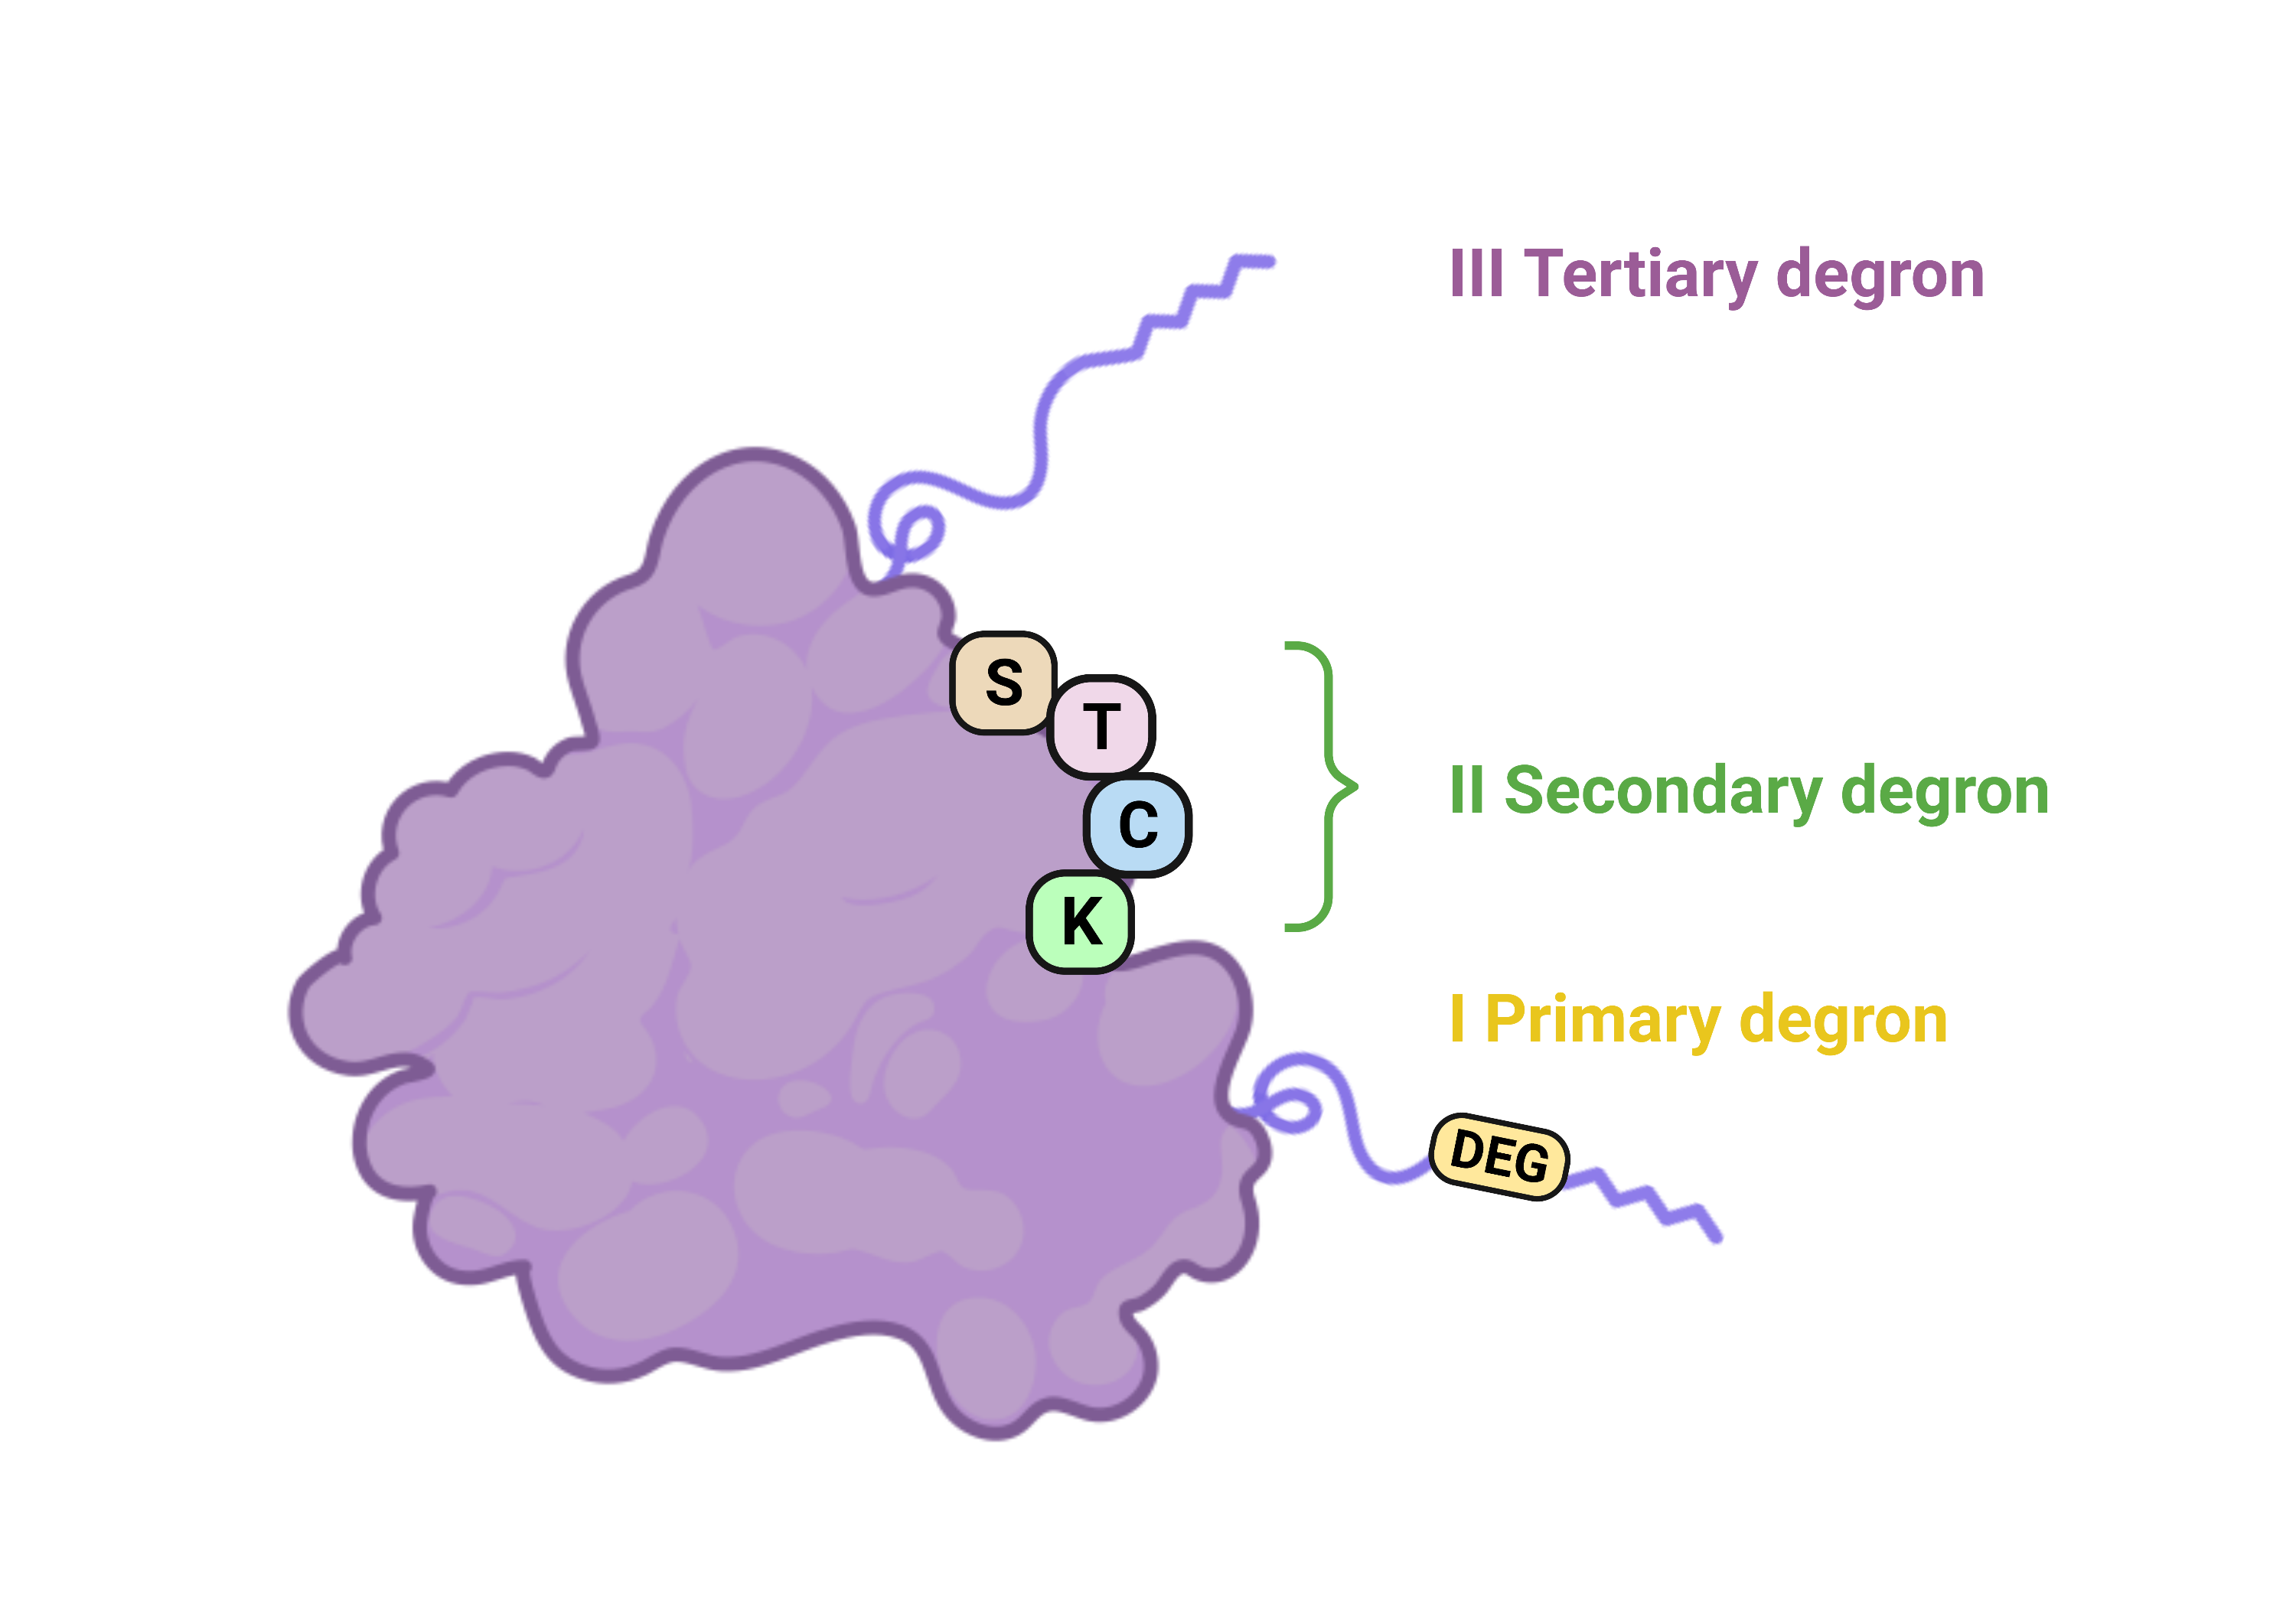
Note that in our implementation, the secondary degron may not only be lysine (K), as ubiquitination can also occur on cysteines (C), serines (S) or threonines (T)2.
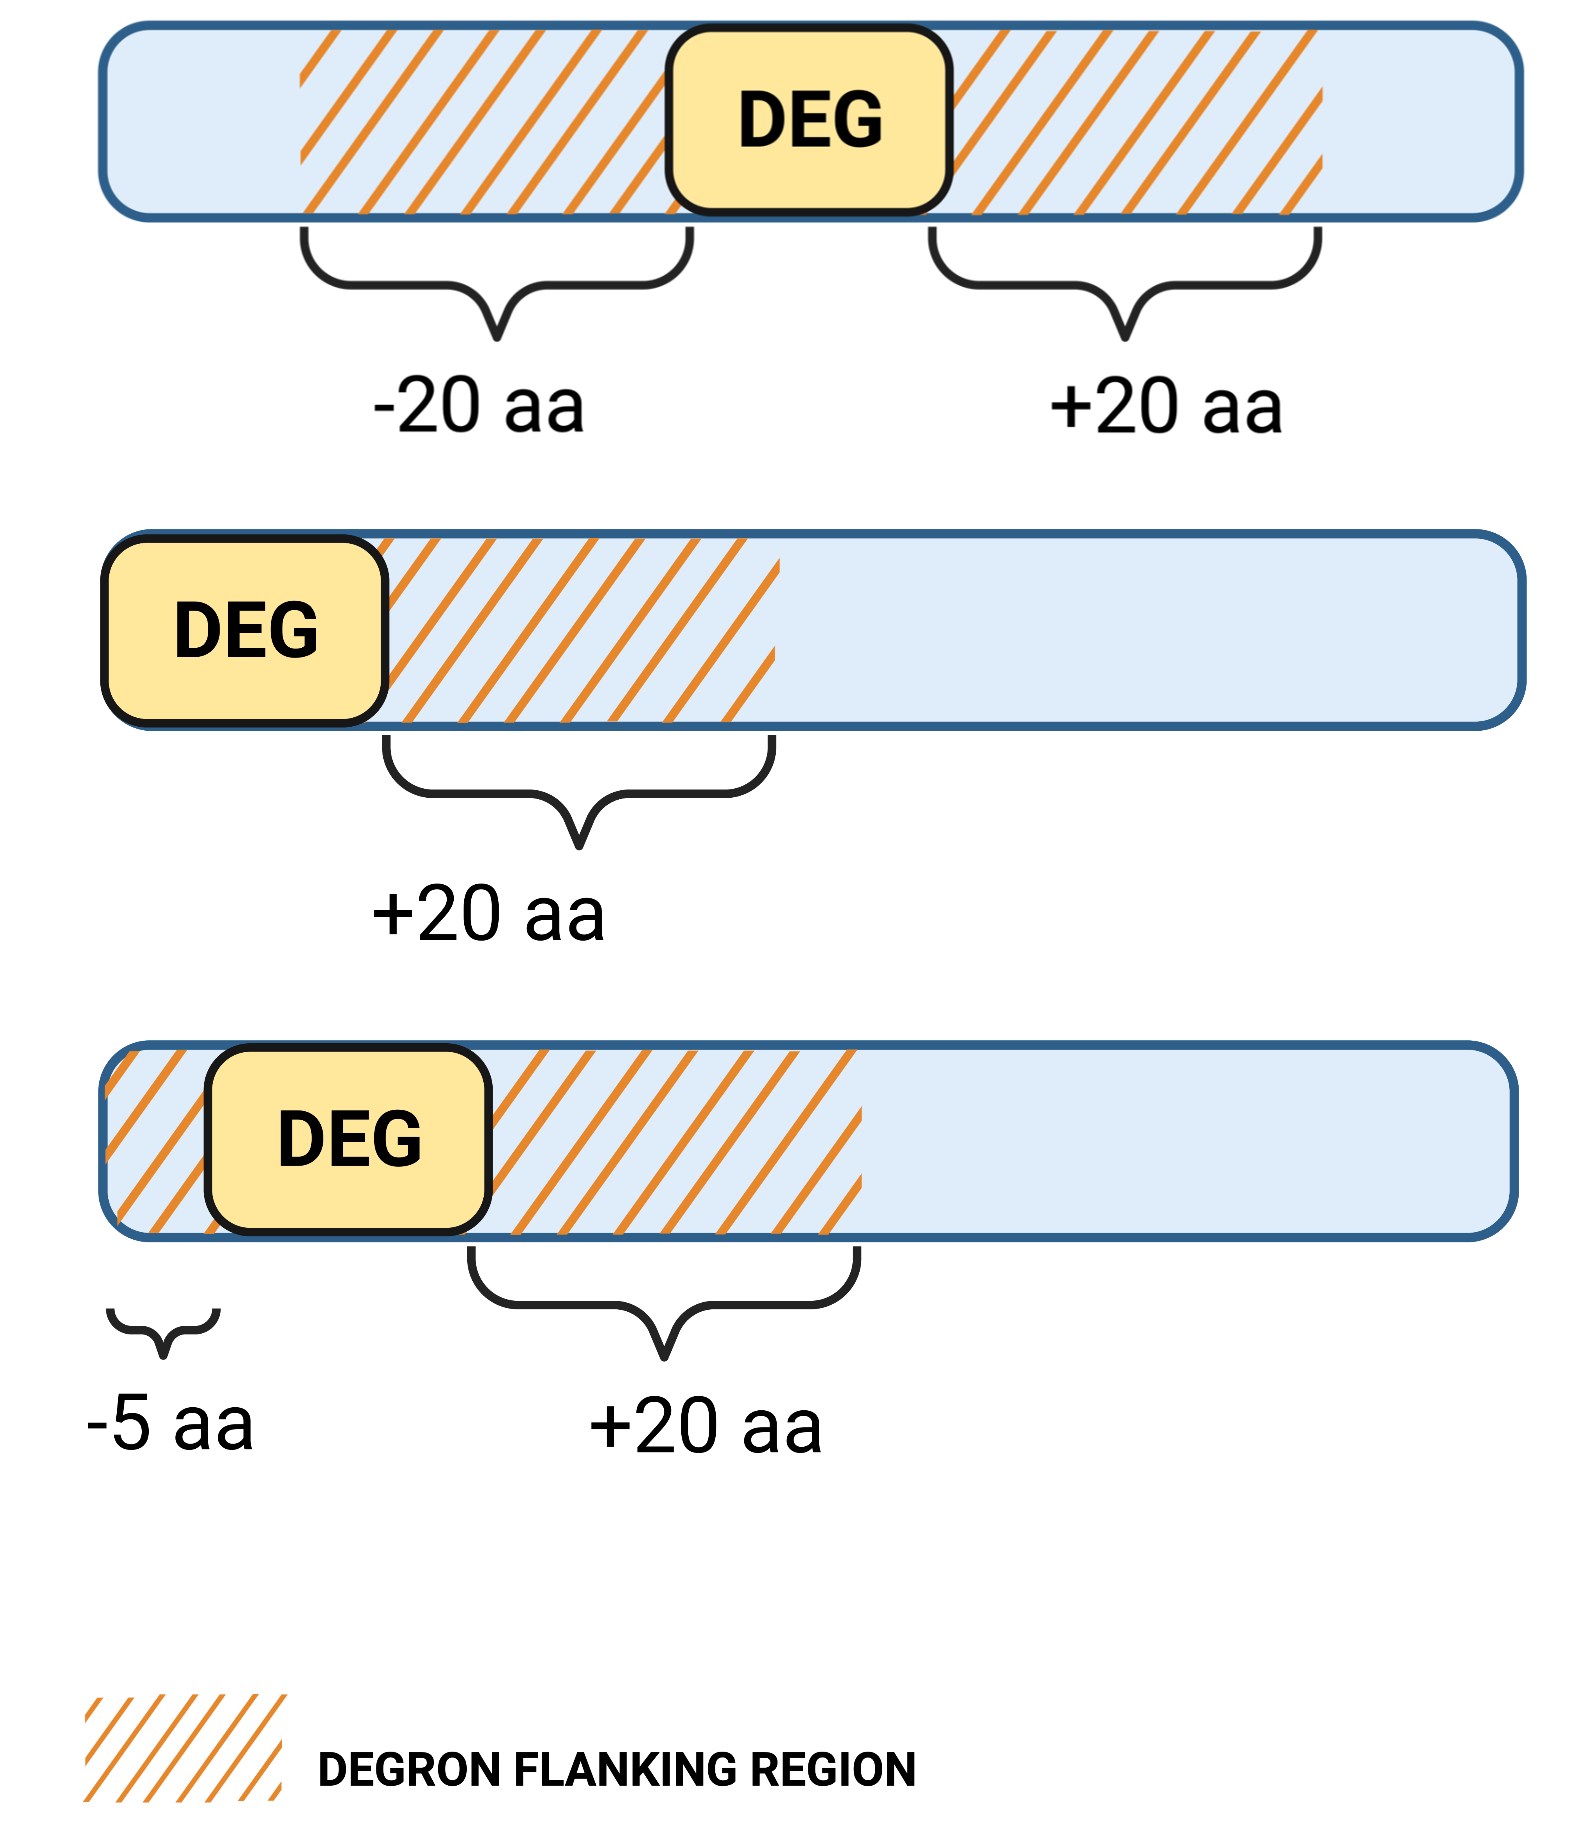
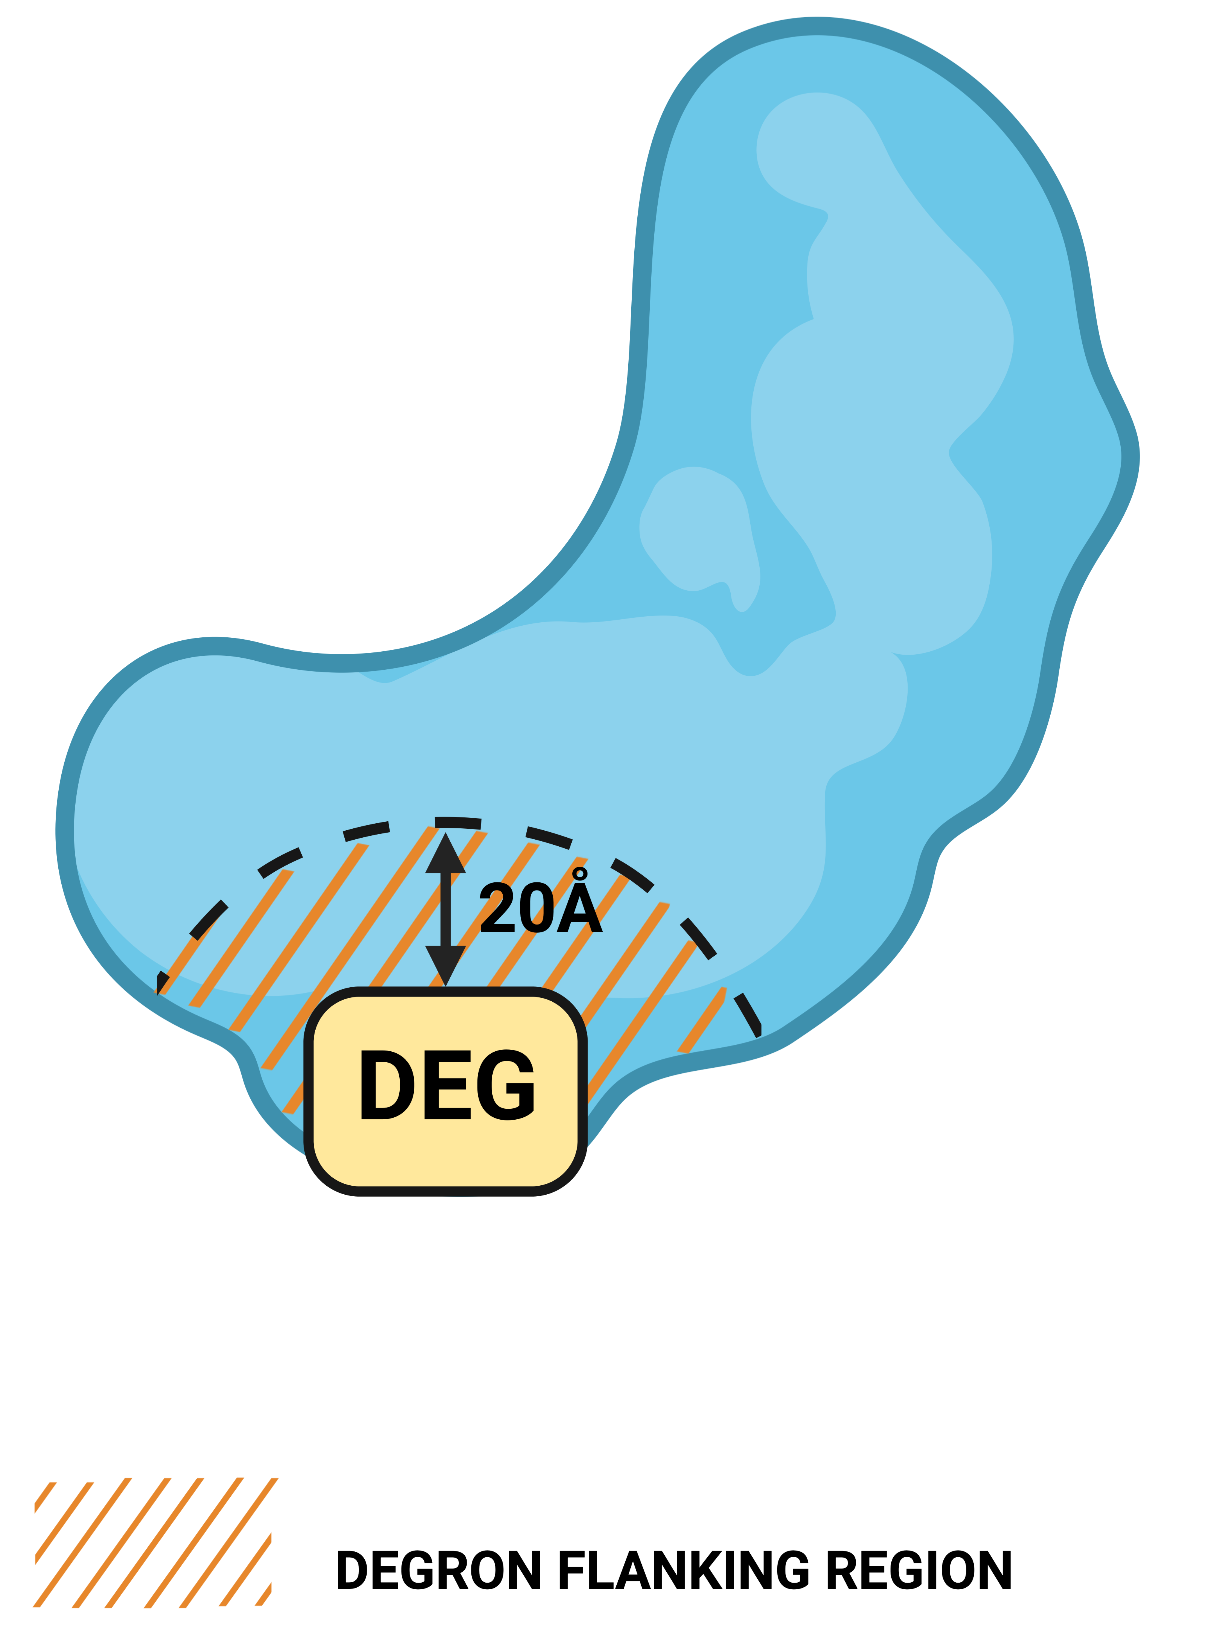
🔵 What are degron flanking regions?
We distinguish two degron flanking regions:
- in sequence - amino acids downstream and upstream of the ends of the degron motif within the distance defined in the Degron flanking region in sequence parameter. Relevant to all query types.
- in structure - residues around the degron motif (excluding the degron motif itself) within the structural distance defined in the Degron flanking region in structure parameter. Relevant to all query by UniProt ID or structure.
🟣 How are secondary and tertiary degrons found?
DEGRONOPEDIA reports not only all degron motifs present in the query protein, but also secondary and tertiary degrons according to the tripartite degron model.
Secondary degrons
We consider not only lysines (K) as potential secondary degrons but also cysteines (C), threonines (T) and serines (S), since ubiquitination may occur on these amino acids18. Secondary degrons (also referred as K/C/T/S) are searched within the degron flanking regions in sequence and structure.📝 Note: Secondary degrons within the degron flanking regions in structure are NOT searched when querying by sequence.
Tertiary degrons
Tertiary degrons are searched within the distance from secondary degrons defined in the Minimum IDR distance from the secondary degron (K/C/T/S) parameter. Tertiary degrons close in sequence are reported for all query types (as intrinsically disordered regions (IDRs) can be predicted from the query sequence using IUPred3), but those close in structure are reported only for query by UniProt ID or structure.📝 Note: Only the closest tertiary degron to each secondary degron is reported (both in terms of sequence and structure).
Proteolysis simulations
Dataset information
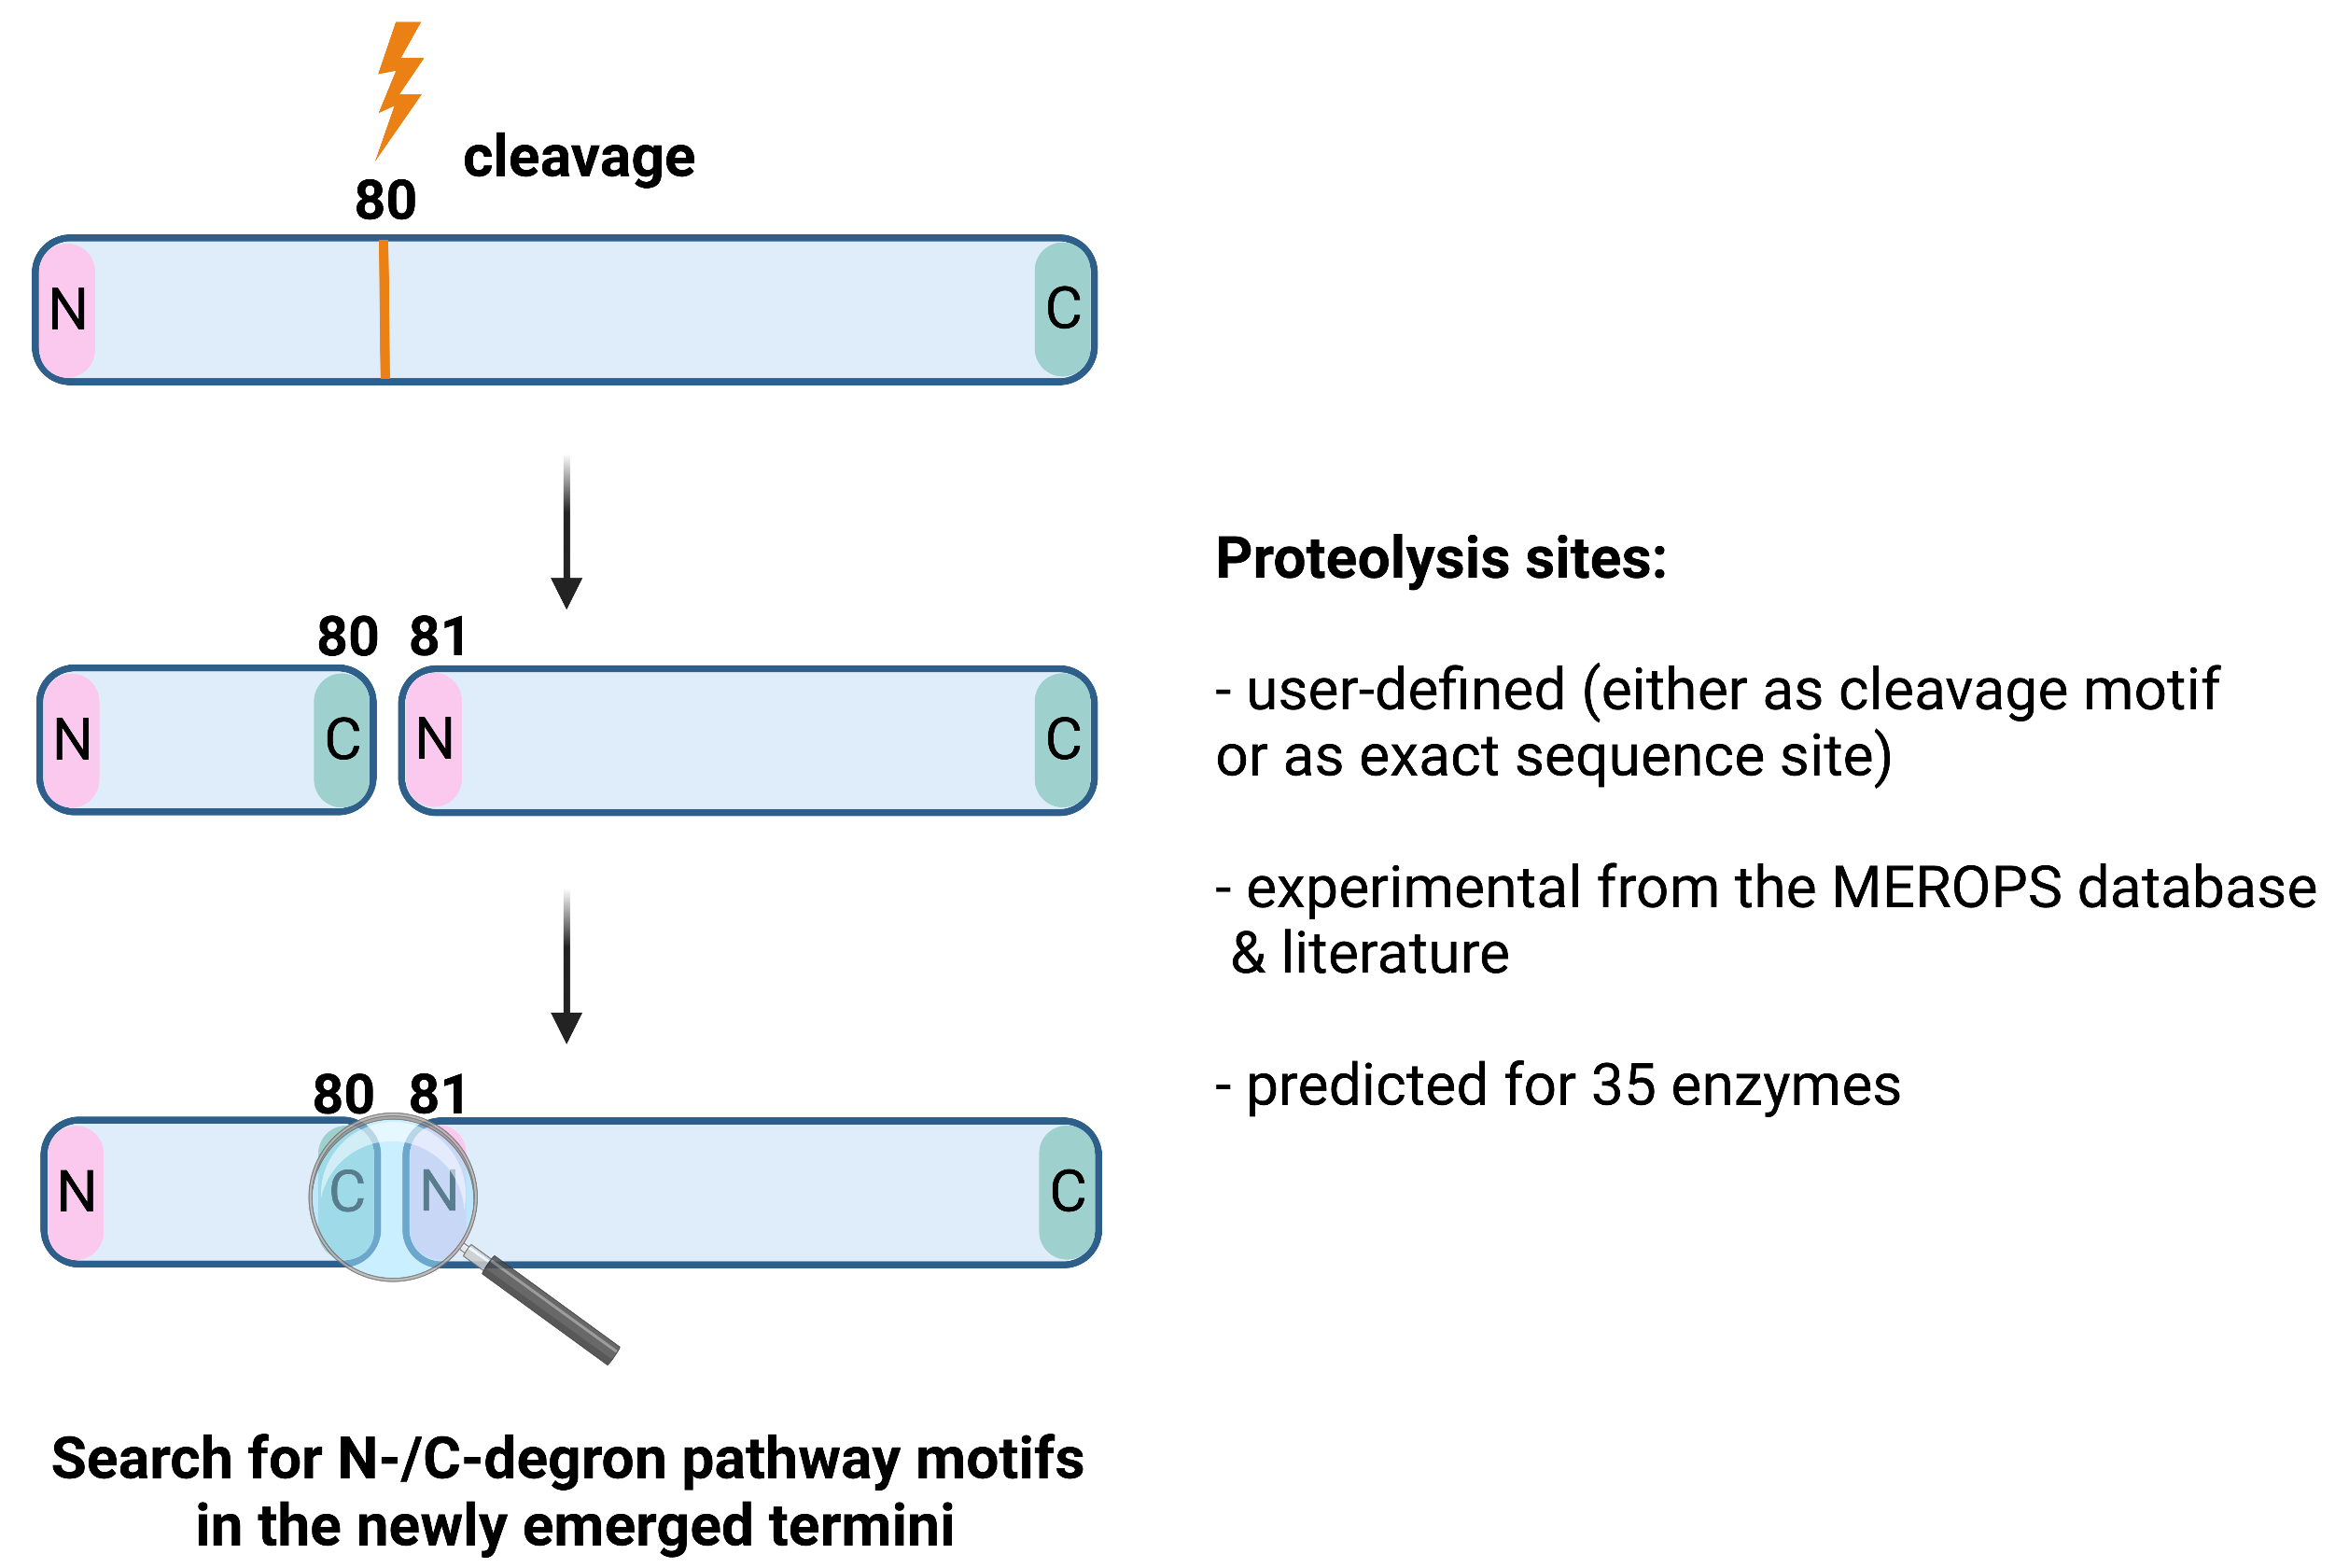
Protein turnover can be regulated by various proteolytic enzymes that cleave the protein, leading to the emergence of new N- and C-terminus that can act as degrons11. DEGRONOPEDIA simulates the cleavage of a query based on a user-defined cleavage motif/site, experimentally validated cleavage sites derived from the MEROPS database (the largest resource of experimental proteolysis data) as well as from the literature, and predicted cleavage sites for 35 different proteolytic enzymes using the Pyteomics module, which implements the PeptideCutter Expasy web server cleavage prediction rules.
Each newly emerged N-/C-termini is then screened for the presence of degron motifs.
📝 Note 1: When defining own cleavage sites e.g. as 80, the cleavage occurs after the given site (see picture below).
📝 Note 2: Degrons are searched in the emerged peptides providing their length is min. 50 amino acids.
E3 interactomes
Dataset information
Since degrons act as a binding site for various E3 ubiquitin ligases, we report the E3s known to interact with the query based on interactome data from the:
- BioGRID
- IntAct
- UbiNet 2.0
- literature
Visualization
Degrons visualizations in the sequence are created using FeatureViewer, while ProSeqViewer and Logomaker package are employed to display degrons within tha MSAs.
Customizable settings
Several parameters can be customized that affect the calculated results. See also the concept of a tripartite degron model.
1. Primary degron-related
1.1. Degron flanking region in sequence
Definition: the maximum sequence distance to regions upstream and downstream of the degron motif to be considered as flankingApplies: to all query types
Unit: aa
Default value: 20
Allowed values: 5-40
1.2. Degron flanking region in structure
Definition: the maximum structural distance to residues around the degron motif to be considered as flanking (note that such residues are not necessarily close in sequence to the degron motif)Applies: to query by UniProt ID or structure
Unit: Å
Default value: 20
Allowed values: 5-40
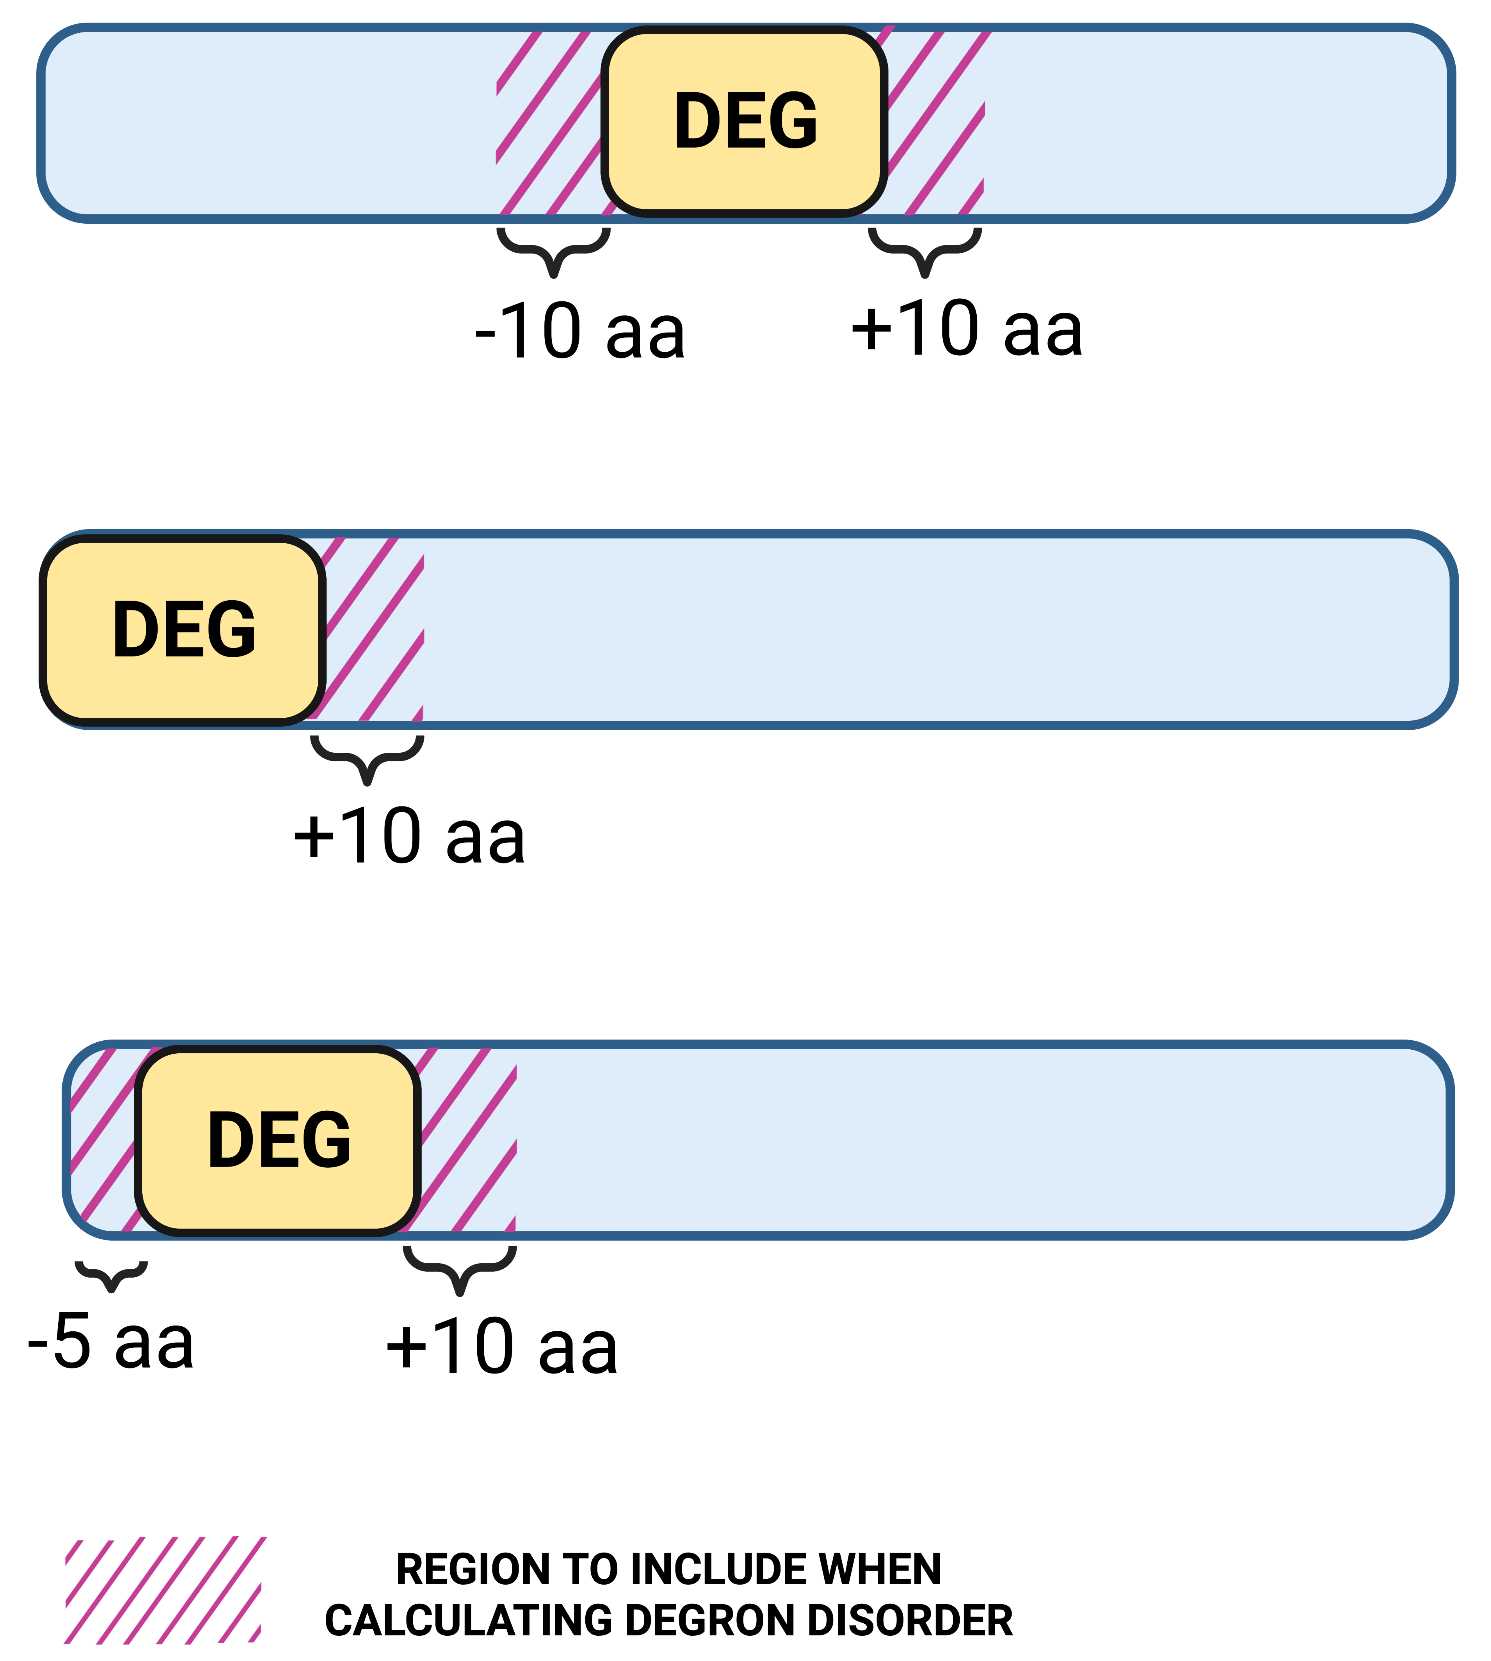
1.3. Region length to calculate degron disorder
Definition: the maximum sequence distance to regions upstream and downstream of the degron motif to be included in the degron mean disorder scoreApplies: to all query types
Unit: aa
Default value: 10
Allowed values: 1-20
2. Secondary degron-related
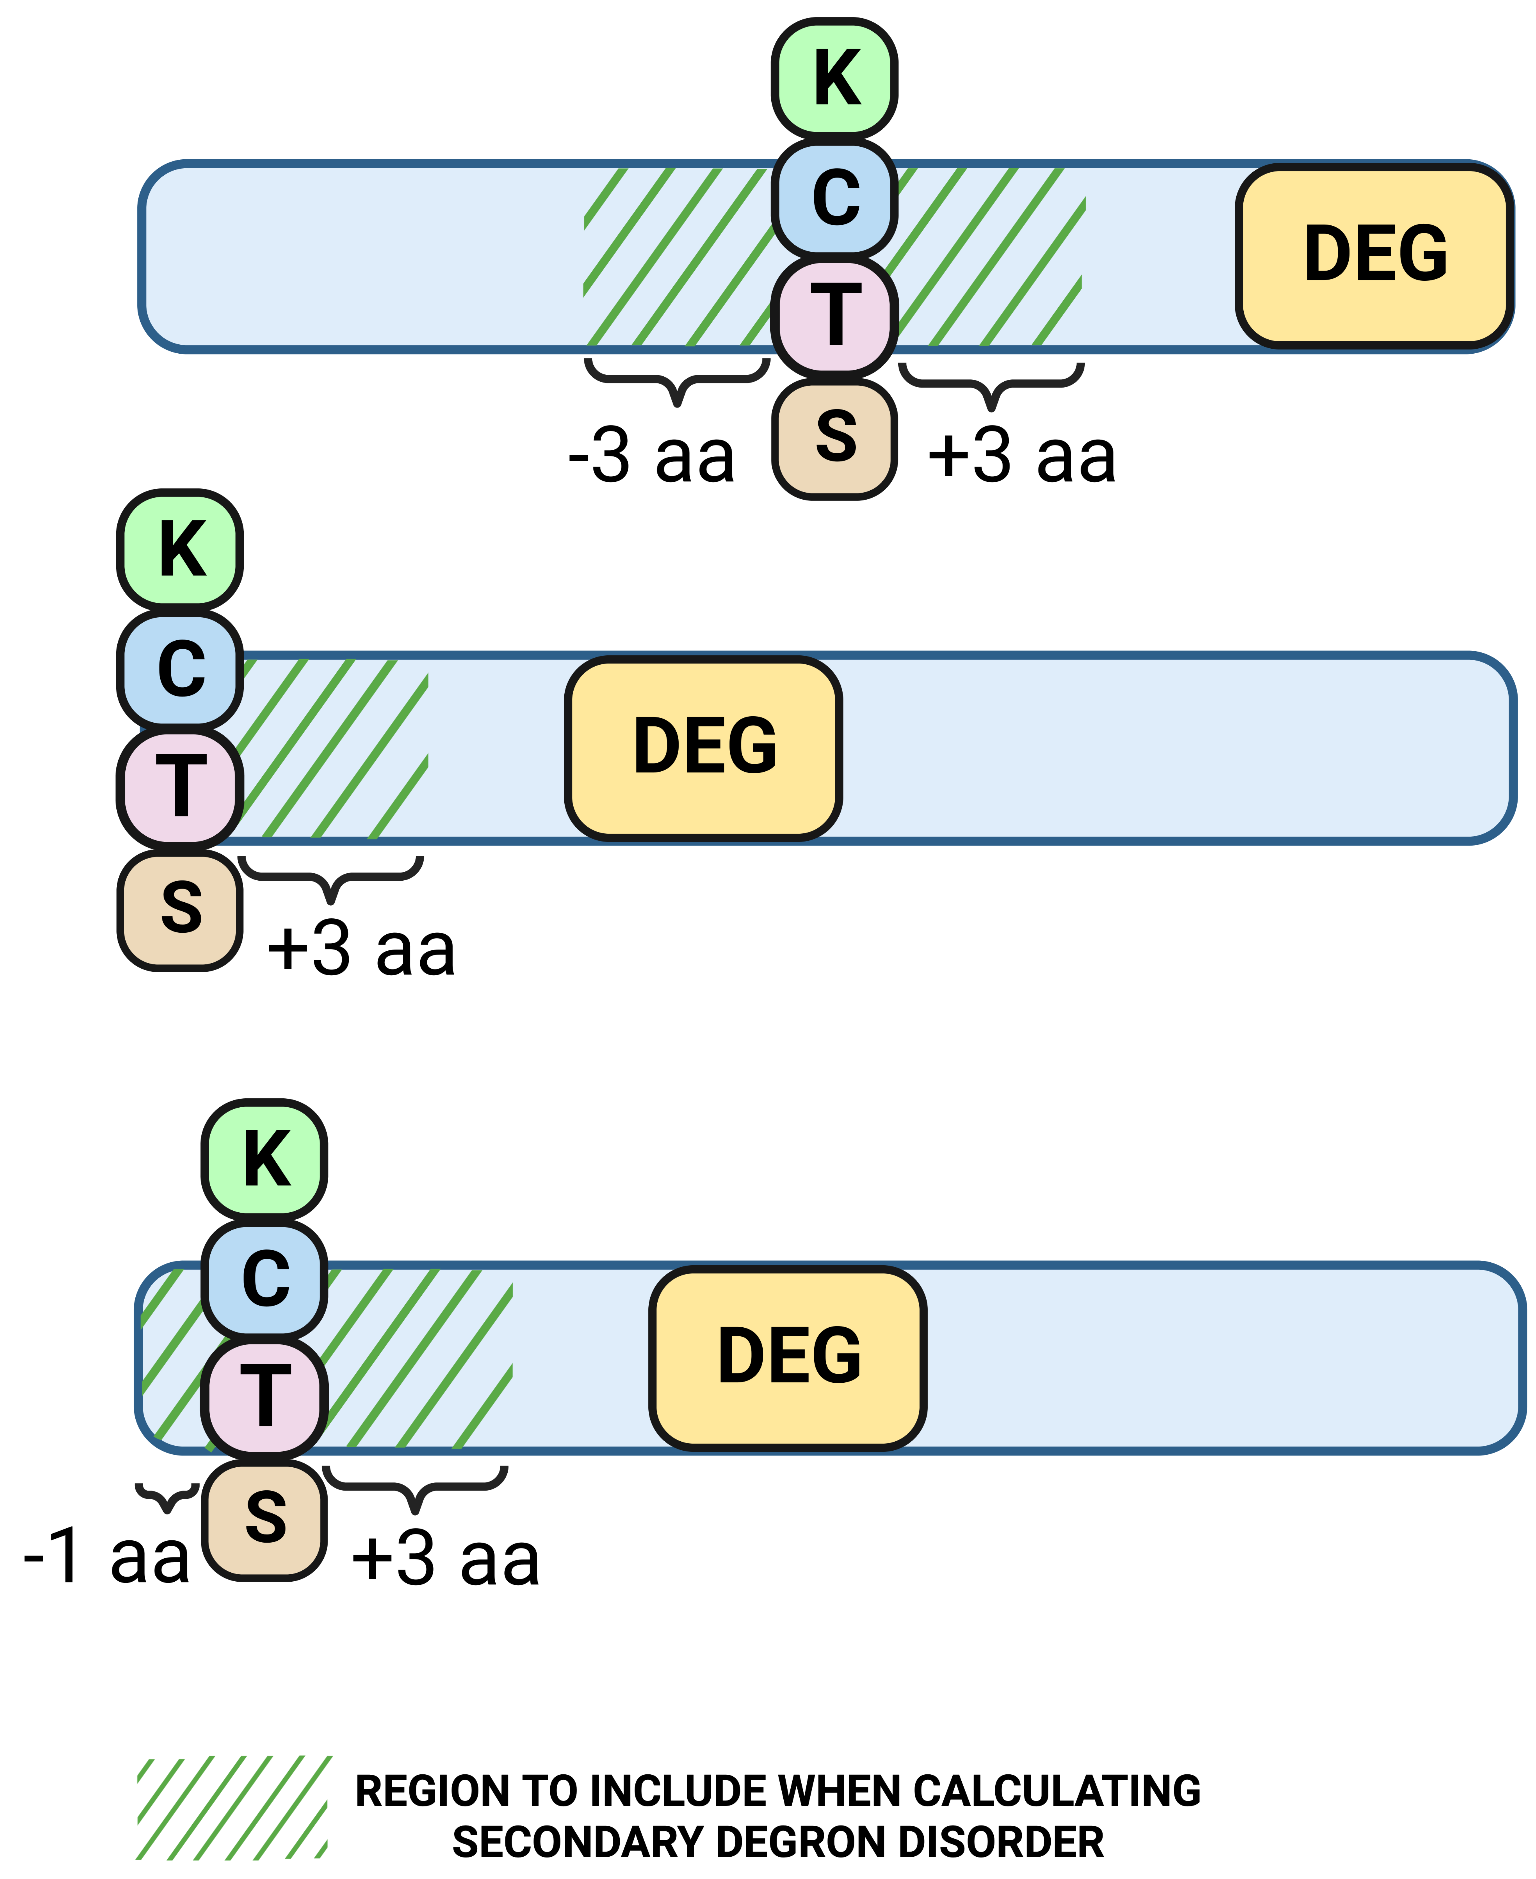
2.1. Region length to calculate secondary degron (K/C/T/S) disorder
Definition: the maximum sequence distance to regions upstream and downstream of the secondary degron (K/C/T/S) to be included in the secondary degron mean disorder scoreApplies: to all query types
Unit: aa
Default value: 3
Allowed values: 1-15
3. Tertiary degron-related
3.1. Minimum IDR distance from the secondary degron (K/C/T/S)
Definition: the minimum sequence distance from the secondary degron (K/C/T/S) to the continuous IDR of a defined length (see Minimum continuous IDR length) to consider it as a tertiary degronApplies: to all query types
Unit: aa
Default value: 10
Allowed values: 5-40
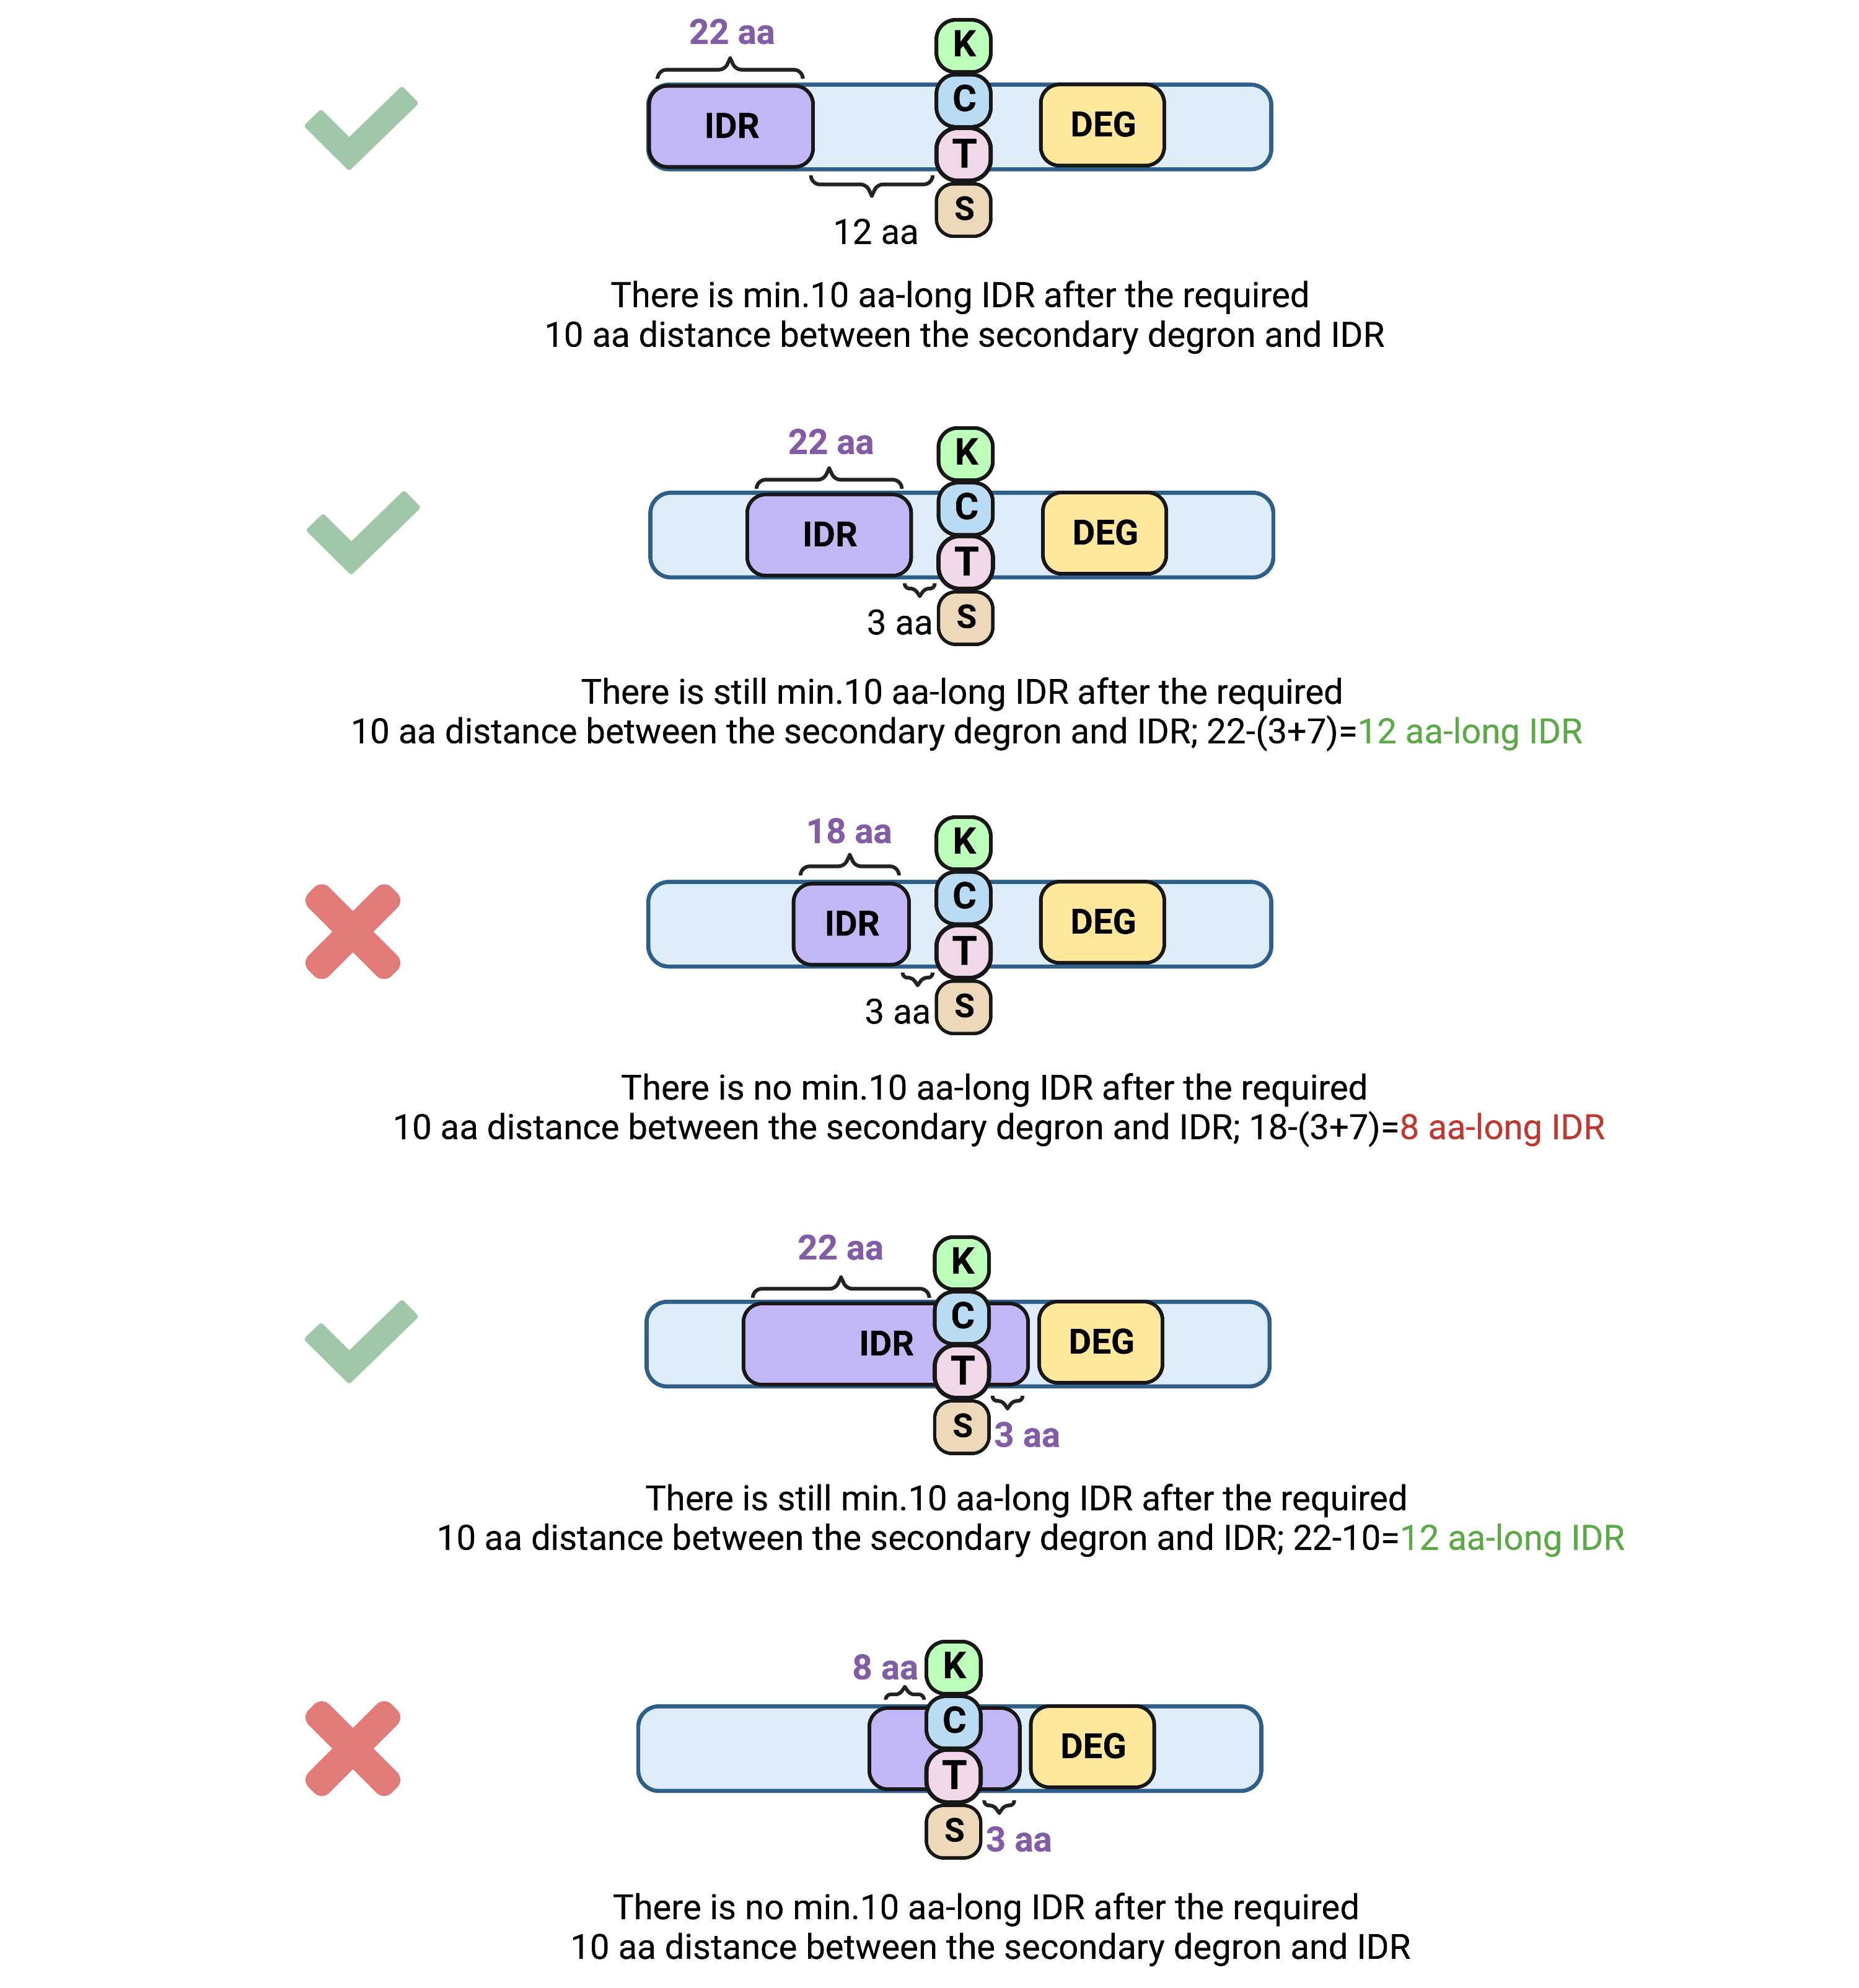
(with both Minimum IDR distance from the secondary degron (K/C/T/S) and Minimum continuous IDR length defined as 10 aa).
4. Structure-related
4.1. Minimum continuous IDR length
Definition: the minimum number of subsequent (in sequence) disordered residues to be considered as an intrinsically disordered region (IDR)Applies: to all query types
Unit: aa
Default value: 10
Allowed values: 5-40
Example: when defined as 10 aa, minimum 10 disorder residues must appear one after another in sequence to recognize them as IDR
See also: How is disorder predicted?
4.2. pLDDT/LDDT disorder threshold
Definition: the threshold below which the residue is considered as disordered based on its confidence pLDDT/LDDT (predicted Local Distance Difference Test/Local Distance Difference Test) score. This structure for which its disorder is to be predicted based on the pLDDT/LDDT scores must be either an AlphaFold2 or RoseTTAFold model.Applies: to query by UniProt ID or structure
Unit: %; pLDDT scores (present in AlphaFold2 models) are in the range of 1-100 and LDDT scores (present in RoseTTAFold models) are in the range of 0-1, so in order to handle both cases, this paramater is defined as %
Default value: 70
Allowed values: 40-90
Example: when defined as 70%, all residues with mean pLDDT/LDDT score (this score should be the same for each atom of the residue, nevertheless the residue mean for all atoms is always calculated) below 70/0.7 (Alphafold2 model/RoseTTAFold model) are considered as disordered
See also: How is disorder predicted?
4.3. IUPred3 disorder threshold
Definition: the threshold above which the residue is considered as disordered based on predictions obtained from the IUPred3 software (sequence-based predictions)Applies: to all query types
Unit: %
Default value: 50
Allowed values: 40-90
Example: when defined as 50%, all residues with the score predicted by IUPred3 above this value are considered as disordered
See also: How is disorder predicted?
4.4. Buried residue threshold
Definition: the threshold below which the residue is considered as buried based on its Relative Solvent Accessibility (RSA) calculated with the DSSP software and normalized using the Sander methodApplies: to query by UniProt ID or structure
Unit: %
Default value: 20
Allowed values: 5-60
Example: when defined as 20%, all residues with the RSA value below 0.2 are considered as buried
See also: How are buried residues defined?
5. Multiple Sequence Alignment (MSA)-related
5.1. Maximum distance from the degron motif in query to consider the same degron motif from the ortholog as conserved
Definition: the maximum distance to regions upstream and downstream of the degron motif (its ends) in the query to its orthologs in the Multiple Sequence Alignment (MSA) to consider it as evolutionarily conservedApplies: to all query types
Unit: aa
Default value: 5
Allowed values: 5-40
See also: Degron conservation scores
Gaps in the alignment within the degron motifs are marked with horizontal dashes.
References
- Kyte, J. & Doolittle, R. F. A simple method for displaying the hydropathic character of a protein. Journal of Molecular Biology 157, 105–132 (1982).
- Kats, I. et al. Mapping Degradation Signals and Pathways in a Eukaryotic N-terminome. Molecular Cell 70, 488-501.e5 (2018).
- Hickey, C. M., Breckel, C., Zhang, M., Theune, W. C. & Hochstrasser, M. Protein quality control degron-containing substrates are differentially targeted in the cytoplasm and nucleus by ubiquitin ligases. Genetics 217, iyaa031 (2021).
- Koren, I. et al. The Eukaryotic Proteome Is Shaped by E3 Ubiquitin Ligases Targeting C-Terminal Degrons. Cell 173, 1622-1635.e14 (2018).
- Timms, R. T. et al. A glycine-specific N-degron pathway mediates the quality control of protein N-myristoylation. Science 365, eaaw4912 (2019).
- Guharoy, M., Bhowmick, P., Sallam, M. & Tompa, P. Tripartite degrons confer diversity and specificity on regulated protein degradation in the ubiquitin-proteasome system. Nat Commun 7, 10239 (2016).
- Erdős, G., Pajkos, M. & Dosztányi, Z. IUPred3: prediction of protein disorder enhanced with unambiguous experimental annotation and visualization of evolutionary conservation. Nucleic Acids Res 49, W297–W303 (2021).
- Holt, L. J. Regulatory modules: Coupling protein stability to phopshoregulation during cell division. FEBS Lett 586, 2773–2777 (2012).
- Mészáros, B., Kumar, M., Gibson, T. J., Uyar, B. & Dosztányi, Z. Degrons in cancer. Sci Signal 10, eaak9982 (2017).
- Eldeeb, M. A., Ragheb, M. A., Soliman, M. H. & Fahlman, R. P. Regulation of Neurodegeneration-associated Protein Fragments by the N-degron Pathways. Neurotox Res 40, 298–318 (2022).
- Varshavsky, A. N-degron and C-degron pathways of protein degradation. Proc. Natl. Acad. Sci. U.S.A. 116, 358–366 (2019).
- Stefanovic‐Barrett, S. et al. MARCH6 and TRC8 facilitate the quality control of cytosolic and tail‐anchored proteins. EMBO Rep 19, (2018).
- Culver, J. A., Li, X., Jordan, M. & Mariappan, M. A second chance for protein targeting/folding: Ubiquitination and deubiquitination of nascent proteins. BioEssays 44, 2200014 (2022).
- Prokhorenkova, L., Gusev, G., Vorobev, A., Dorogush, A. V. & Gulin, A. CatBoost: unbiased boosting with categorical features. in Advances in Neural Information Processing Systems vol. 31 (Curran Associates, Inc., 2018).
- Akiba, T., Sano, S., Yanase, T., Ohta, T. & Koyama, M. Optuna: A Next-generation Hyperparameter Optimization Framework. in Proceedings of the 25th ACM SIGKDD International Conference on Knowledge Discovery & Data Mining 2623–2631 (Association for Computing Machinery, 2019).
- Tunyasuvunakool, K. et al. Highly accurate protein structure prediction for the human proteome. Nature 596, 590–596 (2021).
- Rost, B. & Sander, C. Conservation and prediction of solvent accessibility in protein families. Proteins 20, 216–226 (1994).
- Squair, D. R. & Virdee, S. A new dawn beyond lysine ubiquitination. Nat Chem Biol 18, 802–811 (2022).